MathJax

17 February 2014

5-g's? Let's not Exaggerate.


Watching the Olympics, I have seen a commercial that annoys me. It features a figure skater comparing what she goes through to other occupations. One is that she "experiences more g-forces than a fighter pilot". Let's examine that claim.

The math


The forces on the various parts of a spinning skater are due to rotation. However, we will look at the acceleration since that what g-forces really are. For a 5g-force, the relationship between rotation speed (RPM) and distance from rotation center (r) is

A graph might make this equation a little more meaningful.


So, we can see that a 5-g force can be obtained for a hand rotating 1 meter from the center at a little more that 60 rpm (or one rotation each second). But the head? Even with a skater's head held straight out at around 20 cm, 5-g's would only be experienced at 150 rpm (over 2 rotations per second). And if we look at a 9-g force which most fighter pilots experience occasionally (and for a lot more than a second), it would take 200 rpm. While the supposed world record for a figure skater spin is around 300 rpm, that skater held her head upright, so her nose might feel a 9-g force, her head would feel a much lower force.

Conclusion

What can we conclude? While it is possible that a figure skater can experience over 5-g's of force on some parts of her body, when was the last time you saw a skater do a rapid spin in competition? So, the ad is true, but very misleading. 


27 December 2013

Banning the C-words


Banning the C-words (the physics ones)


Fox Trot by Bill Amend

It has a name and even an equation, so it must be real.

One of the challenges when dealing with circular motion in a typical physics class is getting students to realize that the centripetal force is the result of other forces. One trick that I have used in my class the past few years is to use the phrase "the force needed for circular motion". By never using the term "centripetal force", I try to emphasize that we need other, real forces to make something move in a circle. This approach seems to help when looking at classic examples, like the roller coaster (see a previous post here). This approach also helps because I don't have to get into the discussion of the difference between centripetal and centrifugal. Unfortunately, for typical high school students, once you give something a name, it becomes real.

So, do like I do, and ban the C-words in your class.

24 December 2013

An extra 8 seconds on Jan 4

http://www.xdesksoftware.com/solstice_winter.jpg


21 Dec is the shortest day of the year and 4 Jan is the longest.

We all know that the day of the winter solstice is considered by many the shortest day of the year, but did you know that we can also consider the day of perihelion (4 Jan) as the longest day? It all comes down to how you define the length of a day.

How long is a day?

Ask someone how long a day is and you will probably get the answer, "24 hours". However, ask someone at the US Naval Observatory and you will get "1420x106x60x60x24 vibrations of a hydrogen maser". Ask a farmer and you will get "From sunup to sunset". We have any different definitions. For this post, I am going to use the synodic definition, the time it takes the Sun to go from due south (local solar noon) to the next time it is due south. 

It starts with Kepler.

 Thanks to Johannes Kepler, we know that the Earth orbits the Sun in an eliptical orbit, and that the Earth is moving fastest when it is closest to the Sun (perihelion) and slowest when it when it is farthest (aphelion). 

This year, perihelion occurs on 4 Jan, which will be the longest synodic day of the year. 

Let's figure it out.

Since on the above diagram, the Earth is also spinning counter-clockwise, the diagram below shows (with the added lines) one complete rotation of the Earth for both the day of aphelion (3-4) and the day of perihelion (1-2). Note that the diagrams are exaggerated for effect; the Earth does not really move this far in it orbit in one day.


Notice that it takes a little more than one rotation of the Earth to have the Sun directly due south again. Also notice that the Earth has to rotate a little more at perihelion than at aphelion to be facing the Sun 1 synodic day later.  So a synodic day is longest at perihelion and shortest at aphelion.

But how much longer is it?
  
While the above argument is enough to show that 4 Jan 2014 is the longest (synodic) day of the year, it does not say by how much.  Is it minutes or milliseconds? To answer this, we will need some numbers and the more precise form of Kepler's Law used above.  Kepler figured out that orbiting bodies sweep out equal areas in equal time. And by looking at the diagram above, you can see that the angle swept out by the Earth in one sidereal day is equal to the extra angle the Earth has to rotate to get the Sun due south.

Since the area of a circular sector is
this gives the relationship between for angles swept in equal time.

The Earth-Sun distance is 152,098,232 kilometres (or 1.01671388 AU) at aphelion and is 147,098,290 kilometres (or 0.98329134 AU) at perihelion.  This gives

 Microseconds or Hours?

So, the Earth rotates around the Sun just a little bit less on 5 July than on 22 December. Since the Earth rotates about 1 degree (actually 360/364 degrees), it rotates about 0.033 degrees less on 5 July for 1 synodic day than on 4 January. How long does it take the Earth to rotate that angle? Since it takes 24 hours to rotate 360 degrees, it takes about 8 seconds to rotate that 0.033 degrees. So the synodic day on 4 January is about 8 seconds longer than the synodic day on 5 July.


Classroom use.

Unless you are teaching summer school, this is not much use in the classroom.  However, if you flip the seasons, you can show that the day of perihelion is the longest day of the year (and it is close the the "shortest" day of the year, 22 Dec). Since the first day back from the Christmas break is close to 4-5 Jan, I use this for a gradual welcome-back class.  In a regular physics class, we just do the qualitative approach with students playing the parts of the Sun and the Earth.

The discussion starts with what causes the seasons.  It helps to have a globe handy at this point. We then discuss Kepler's laws. I get one student to play the part of the Sun and one the Earth.  Depending on time, I might have the class discuss how the Earth should rotate (the Sun rises in the east). If not, I will just get the Earth rotating in the correct way.  The class decides when the Earth has rotated one complete rotation relative to the room and then notices that it is the Earth (the student) is not facing the Sun. That 5 minute activity sets up the above discussion.

A related post (http://canisiusphysics.blogspot.com/2013/03/if-spring-starts-tuesday-why-does.html)


11 November 2013

Get a Pi

You have to get a Raspberry Pi


 A computer for $35?

The Raspberry Pi computer has the optimal combination of price and power. While it will  not replace your laptop or desktop, it can do a lot for the price of week's worth of Starbuck's coffee.

If you want to use the Pi as a standalone computer, you will need a keyboard, a mouse, a power source, and a monitor (as long as it has an HDMI connection). Unless you have these hanging around, the Pi might not be worth the trouble. But you can do a lot with the Pi even with out the extras.

Different distros, different uses

Since the Pi was first let loose on the world, many people have made different variants of the main operating system (OS) that can be used. Imagine a version of Windows tailored for high school teachers, a different one for senior citizens, one for bankers, etc. 

The general purpose OS for the Pi is Raspbian. For those familiar with Linux or even Windows or OS X, it will look familiar (what you see above). If you plopped  most people in front of a monitor showing the above, they could figure out what to do within a few minutes. But what can you do without a monitor?

The Headless Horseman

As with any computer, the Pi can be run "headless", in other words, without a monitor. While it requires that the Pi is connected to your home network and that you know how to find its IP address. You also need to know how to use SSH and VNC on another computer. There are plenty of sites available to help you. Here is a good one. This is the main use of my Pi so that I can listen to internet radio stations like Xponential Radio and WQXR2 (Living Music, Living Composers).

A New SD Card, a New Computer

What is also nice is that the OS is stored on an SD card. That means that you can easily swap cards and have another OS for your Pi. One that I am currently trying is one that make your Pi a high-end audio server. While it is still in the development stages, it has promise, and when I want to do something different, I just pop out that card and put in another one.

Another use for the Pi is as a video media server. Since it has an HDMI output, you can connect it to any TV with such ports. One such distro is Raspbmc. I have not tried it yet since I am still in the stone ages with TV (it's a CRT). You can see a list of other distros can be seen here.

It can be hidden.

One last use that I want to mention. Since the Pi is small, it can be tucked away in the corner of a typical academic office and not noticed. I did that to a colleague, and attached some old computer speakers turned up loud. Since the Pi was connected to the school's network, I could control it from my laptop in my room at the other side of the building. At a time when I knew he was alone in his office, I started the Pi playing some hideous Christmas music. After an initial fright, he knew who to blame. At least he didn't crush the Pi.

09 November 2013

The Crusher

DSC_0304


Every year, on the Saturday before Thanksgiving, the Western New York Physics Teachers Alliance (WNYPTA) puts on its Physics Olympics for area high school and middle school students. We try to make it a low-key affair (one member calls it "the anti-Science Olympiad").

The Crusher

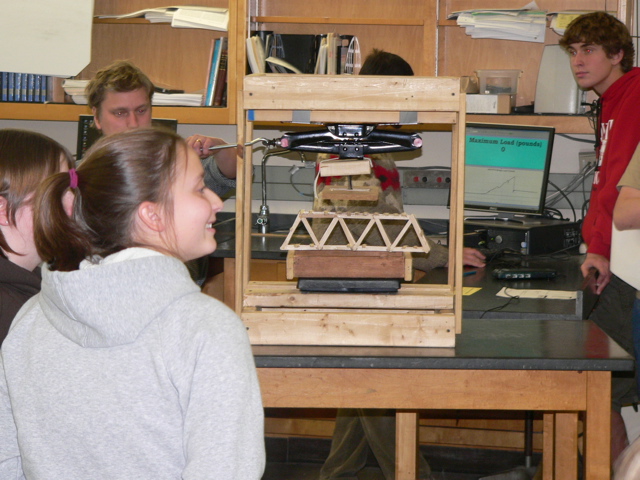
One of the traditional events at the Physics Olympics is the structure building contest. The actual structure changes from year to year. We have built bridges, cranes, towers, and cantilevers with the usual craft sticks and hot glue or sometimes with straws and toothpicks or other material. What I want to share on this blog post is how we test-to-failure some of these structures. Years ago, we used the usual low-tech methods like hanging a bucket from a bridge and gradual filling it with water. While time-honored, I wanted to add a little razzle-dazzle to the event. So I made the Crusher (seen below with the latest version at the end of this blog).


P1100839

The Crusher is a simple structure; it is just a crate that holds a Vernier Force Plate on the bottom and the loading mechanism above. That mechanism consists of an old scissors car jack with a swiveling plate below (to make sure that the load is applied across the structure even if it is not built perfectly level). With a computer running Vernier's LoggerPro software and projecting to a screen at the front of the room, the entire room can watch the as the load is increased until failure. You can see an example in the background of the above picture. And we can print out the graph for the team to bring back to school for bragging rights.  However, there was one detail that took me a while to figure out.

The Razzle-Dazzle


The one detail that I wanted for the display was to have the Maximum Load shown. The problem was that meter-display box would show the current load. Once the structure was compromised, the display would not show the maximum. However, after a couple hours of trying various settings, I figured out what to do. I include the details below for those readers who use Vernier products and who might want to do similar.

First set up two pages in LoggerPro. One page will have the raw data in spreadsheet form. Add a "calculated column" which stores the maximum value of the "Force" column. On the second page, add a graph of the Force and a meter showing the Maximum Force. Here is what took me a few hours to figure out; there is an option under the "Experiment" toolbar called "Live Readouts". When zeroing-out the Force Plate when the structure is placed on it, the "Live Readouts" options has to be enabled, but then it has to be un-enabled when the load is being applied and until after the print-out of the graph has gone through. If you are successful, you will get a page showing something like below.

If you are interested in using this setup in your classroom or extra-curricular activity, I am willing to share the LoggerPro file.  Just email me at the blog's associated address.


More Razzle-Dazzle

This year, I am going to add a new component. Vernier's DataShare feature (which I have written about before) will allow me to broadcast this graph to those students (and parents) who have smart-phones with a web-browser.


Here is an example of the WNYPTA cantilever event from 2011 using the same LoggerPro setup as above but with a Force Sensor instead of the Force Plate. The scoring for this event was based on the product of the lever arm distance and the maximum load. By inserting a Parameter Control, I can input the length of the arm and LoggerPro will calculate the above product and display it for all to see up front.


CIMG0983l


The Crusher, 2nd Modification


You might have noticed a major problem with the version of the Crusher shown above; it applies the load to the top of the bridge. One of my projects this summer was to modify the Crusher to apply the load to the deck of the bridge so that I can use it in the Intro to Engineering course I am teaching this year. You can see that major modification below. In essence. I just added a removable rod that can go through the bridge and apply the load inside.


Here are some hints if you want to build one of your own.

Bill of Materials

Scissors Jack
     you can borrow the one from your car or find one at a junk yard for $5-10

Top and bottom plates
     I modified an old teacher cart in the example above, and have used old pressboard from an Ikea desk for another, but you can make yours with some scrap plywood and scrap 2x4 lumber screwed in at the corners to attach the pillars.

Pillars
     hockey sticks are used here simply because I had a number of them available, but you can use 1x3 or 2x2 lumber available at your local hardware store. If you have four 2-3 foot long 2x4’s lying around, you could use those also but the structure will be heavier. Start with 3 foot lengths since you can raise the Force Plate with books if needed. You can trim them later when you have a better idea about what height you need.

Load Frame
     the lumber you use for three parts of the frame (the horizontal member attached to the scissors jack and the two vertical members) can be the same that you use for the pillars, however, the lumber you use for the load member you need to choose with care. It, along with the Load Foot (see below), need to be small enough to pass through the bridges you are having your students build. For the bridge I show in the photo, the pass-through is about 2 inches square. I hold the lower member to the load frame with steel and magnets to facilitate easy disassembly, but you could attach with a couple of rubber bands.

Load Foot
     If you want to exert the downward force on only a small portion of the structure, you will need to affix a load foot to the lower load frame member. I have used the swivel head of an old C-clamp to allow the load foot to compensate for less than level bridge decks. The car was added just for whimsey.

Structure Supports
     If you want to specify a bridge-span wider than the Force Plate, you will need to tack together a simple frame. Easy enough to do with any scrap you have around.



21 October 2013

Don't Text and Drive


There are certain classic physics labs. The ruler-reaction time lab is one of those. It is simple, requires little equipment, but gives students something they can relate to. 

Good Artists (Teachers) Borrow, Great Artists (Teachers) Steal


 A while ago, I saw on my Twitter feed a picture from a teacher who does a variation of this lab (I didn't save that tweet, so I can't properly credit that teacher). It showed students with a cell phone in one hand and their other hand waiting for the drop. So I modified that lab for my students. They went through 5 trials to get a reaction time with no distractions. Now comes time for the distraction.

I can use a cell phone in class?

While I had my guys, working in teams of three with one being tested and one dropping the ruler and one receiving the text message from the testee, using cell phones, I realize now that any active distraction will do. I could even have them using calculators. What matters is that the brain is trying to actively focus on two things at once. I could have the third team member ask the testee to use a calculator to calculate something "What is 5+7-5*25.......no I meant 23+3.....".


The results were as expected; the average distracted reaction time is more than the undistracted reaction time. And most students will see their distracted times more deviated than the undistracted times. The lesson here is that while you might get away once or twice with texting while driving, you cannot always count on a good reaction time.

06 October 2013

Why I still use WinPlot

Why I still use WinPlot (even on my MacBook)

WinPlot has been a major tool for me for more than 15 years. When I want to add a graph or a set of axes to a test or homework, it is my go-to app. It has the perfect combination of ease of use and lots of features. I have written a couple of posts on WinPlot before (here and here). However, when my school changed the teacher laptops to MacBooks, I couldn't take the program with me.

My requirements for a replacement are basic. I want to make graphs of functions (sometimes piece-wise), change the scales on both axes independently, and label the axes with appropriate units. An example is below. I knocked this one off in about 10 minutes for my AP class. I wanted to give them some idealized elevator acceleration data they could practice with so that they might be able to do something with the messy data they got. Note the labels for the y-axis and the x-axis.


I have looked for such a program for my MacBook, but have not found one as flexible. The app Grapher that comes with OS X does not have all the flexibility needed. I even looked at using gnuplot, which I consider the Ferrari of plotting programs. However, since I would be using it only sporadically, I need a GUI to help me navigate all the available options. Haven't found one that works on Macs.

Bottle that Vintage

My OS of choice at home is Linux. And so I am familiar with the Wine project. It allows one to run many Windows programs in Linux. And since the latest Apple OS's are based on Linux, there is hope. I could have delved in the back room of the Terminal application, but I came across something better.

Wine Bottler is a program that takes a Windows program and makes a Mac app for you. You can then run them just like any Mac app (with some limitations). It was easy to make a WinPlot app that runs just fine on my MacBook. I can run it just like I did a few years ago. But there is a price. While I could just copy-paste the graphs between programs in Windows, I can't do so with the Wine-Bottled versions. I just have to save the graph as a graphic file and then import that file into the document I am creating.

Another price is that the apps made by Wine Bottler are bigger than the native version and you have to have the X11 app installed. But if you have a favorite Windows program and want to find a way to run it in OS X without installing Parallels, you might want to check out Wine Bottler.