
WinPlot is a labor of love of Richard Parris at Phillips Exeter Academy. He updates the program frequently and is very open to suggestions for improvement. The program is very easy to use, runs without officially installing it onto a computer (you can run it from your own personal directory), and has a lot of useful features. It is my "goto" for inserting graphs and axes into my class documents. This post will not attempt to be a tutorial on how to use WinPlot; one can be found at the main site.
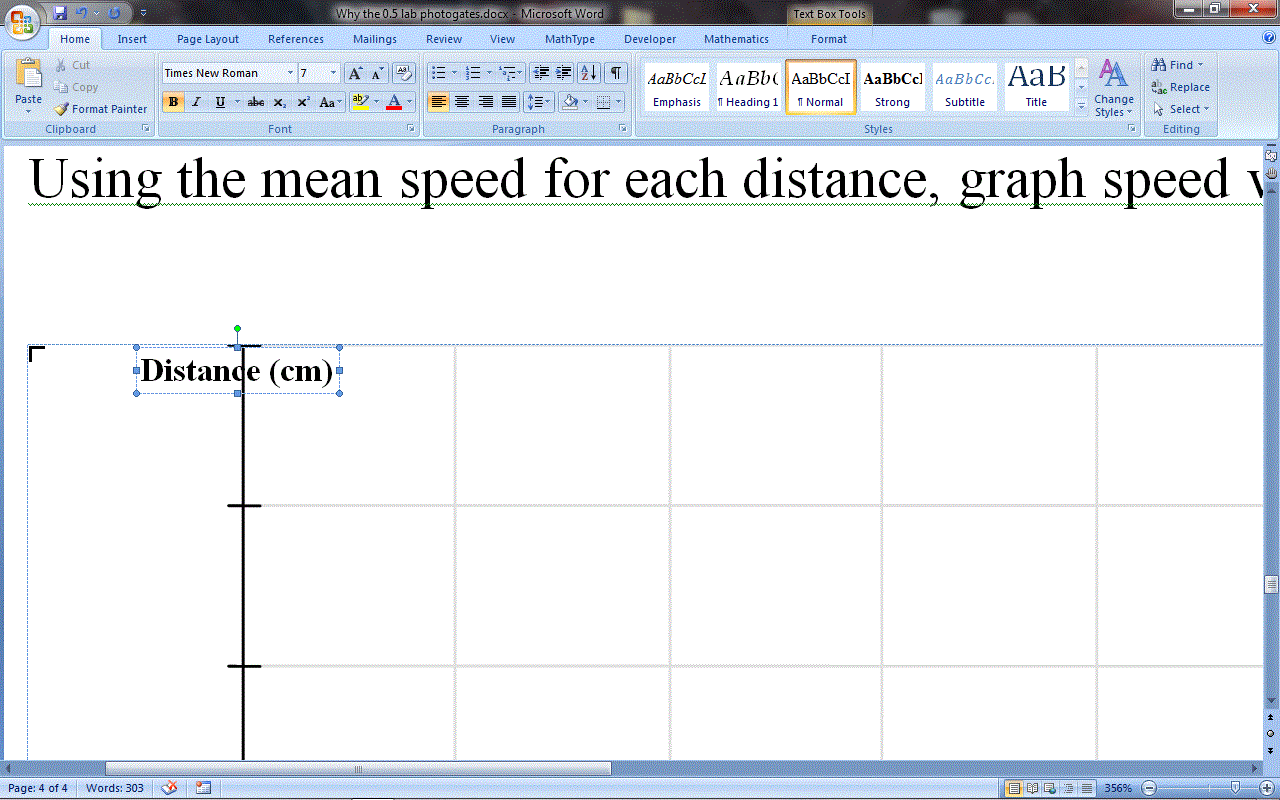
The one "hidden"feature that got me excited today is a quick way to edit a WinPlot graph already in an editable electronic document. For years, whenever I wanted to change the labels on a set of axes, I would open up WinPlot and either modify an already saved plot or create a new one with the wanted labels. Today, I stumbled upon a shortcut. Below is a graph that I had created in WinPlot, copied there, and then pasted into my word-processing program.

I want to change the label on the vertical axis. By clicking on the image, I entered the edit mode, as shown by the corner marks. And, then by clicking on the axis label, the textbox is selected for editing.

I can then change the label to anything I want without having to go back to WinPlot.
A time saver that I will use many times in the future.
Addendum
While I have much praise for WinPlot, my one complaint about is that it is a Windows only program. Whenever possible, I like to use cross-platform programs. For publication-ready plots and graphs, I recommend GNUPlot, which is cross-platform. GNUPlot is by itself a command-line program, but there are many GUI's available that are helpful (the Windows and Mac versions already has the GUI built in). It is much more powerful program than WinPlot, and so can take some time to learn, but it will produce graphics that can be use in professional publications. If you are looking for the Ferrari (but still free) of graphing programs, try GNUPlot. However, as powerful as GNUPlot is, it still can't do the above trick that WinPlot can.
No comments:
Post a Comment