MathJax

27 December 2013

Banning the C-words


Banning the C-words (the physics ones)


Fox Trot by Bill Amend

It has a name and even an equation, so it must be real.

One of the challenges when dealing with circular motion in a typical physics class is getting students to realize that the centripetal force is the result of other forces. One trick that I have used in my class the past few years is to use the phrase "the force needed for circular motion". By never using the term "centripetal force", I try to emphasize that we need other, real forces to make something move in a circle. This approach seems to help when looking at classic examples, like the roller coaster (see a previous post here). This approach also helps because I don't have to get into the discussion of the difference between centripetal and centrifugal. Unfortunately, for typical high school students, once you give something a name, it becomes real.

So, do like I do, and ban the C-words in your class.

24 December 2013

An extra 8 seconds on Jan 4

http://www.xdesksoftware.com/solstice_winter.jpg


21 Dec is the shortest day of the year and 4 Jan is the longest.

We all know that the day of the winter solstice is considered by many the shortest day of the year, but did you know that we can also consider the day of perihelion (4 Jan) as the longest day? It all comes down to how you define the length of a day.

How long is a day?

Ask someone how long a day is and you will probably get the answer, "24 hours". However, ask someone at the US Naval Observatory and you will get "1420x106x60x60x24 vibrations of a hydrogen maser". Ask a farmer and you will get "From sunup to sunset". We have any different definitions. For this post, I am going to use the synodic definition, the time it takes the Sun to go from due south (local solar noon) to the next time it is due south. 

It starts with Kepler.

 Thanks to Johannes Kepler, we know that the Earth orbits the Sun in an eliptical orbit, and that the Earth is moving fastest when it is closest to the Sun (perihelion) and slowest when it when it is farthest (aphelion). 

This year, perihelion occurs on 4 Jan, which will be the longest synodic day of the year. 

Let's figure it out.

Since on the above diagram, the Earth is also spinning counter-clockwise, the diagram below shows (with the added lines) one complete rotation of the Earth for both the day of aphelion (3-4) and the day of perihelion (1-2). Note that the diagrams are exaggerated for effect; the Earth does not really move this far in it orbit in one day.


Notice that it takes a little more than one rotation of the Earth to have the Sun directly due south again. Also notice that the Earth has to rotate a little more at perihelion than at aphelion to be facing the Sun 1 synodic day later.  So a synodic day is longest at perihelion and shortest at aphelion.

But how much longer is it?
  
While the above argument is enough to show that 4 Jan 2014 is the longest (synodic) day of the year, it does not say by how much.  Is it minutes or milliseconds? To answer this, we will need some numbers and the more precise form of Kepler's Law used above.  Kepler figured out that orbiting bodies sweep out equal areas in equal time. And by looking at the diagram above, you can see that the angle swept out by the Earth in one sidereal day is equal to the extra angle the Earth has to rotate to get the Sun due south.

Since the area of a circular sector is
this gives the relationship between for angles swept in equal time.

The Earth-Sun distance is 152,098,232 kilometres (or 1.01671388 AU) at aphelion and is 147,098,290 kilometres (or 0.98329134 AU) at perihelion.  This gives

 Microseconds or Hours?

So, the Earth rotates around the Sun just a little bit less on 5 July than on 22 December. Since the Earth rotates about 1 degree (actually 360/364 degrees), it rotates about 0.033 degrees less on 5 July for 1 synodic day than on 4 January. How long does it take the Earth to rotate that angle? Since it takes 24 hours to rotate 360 degrees, it takes about 8 seconds to rotate that 0.033 degrees. So the synodic day on 4 January is about 8 seconds longer than the synodic day on 5 July.


Classroom use.

Unless you are teaching summer school, this is not much use in the classroom.  However, if you flip the seasons, you can show that the day of perihelion is the longest day of the year (and it is close the the "shortest" day of the year, 22 Dec). Since the first day back from the Christmas break is close to 4-5 Jan, I use this for a gradual welcome-back class.  In a regular physics class, we just do the qualitative approach with students playing the parts of the Sun and the Earth.

The discussion starts with what causes the seasons.  It helps to have a globe handy at this point. We then discuss Kepler's laws. I get one student to play the part of the Sun and one the Earth.  Depending on time, I might have the class discuss how the Earth should rotate (the Sun rises in the east). If not, I will just get the Earth rotating in the correct way.  The class decides when the Earth has rotated one complete rotation relative to the room and then notices that it is the Earth (the student) is not facing the Sun. That 5 minute activity sets up the above discussion.

A related post (http://canisiusphysics.blogspot.com/2013/03/if-spring-starts-tuesday-why-does.html)


11 November 2013

Get a Pi

You have to get a Raspberry Pi


 A computer for $35?

The Raspberry Pi computer has the optimal combination of price and power. While it will  not replace your laptop or desktop, it can do a lot for the price of week's worth of Starbuck's coffee.

If you want to use the Pi as a standalone computer, you will need a keyboard, a mouse, a power source, and a monitor (as long as it has an HDMI connection). Unless you have these hanging around, the Pi might not be worth the trouble. But you can do a lot with the Pi even with out the extras.

Different distros, different uses

Since the Pi was first let loose on the world, many people have made different variants of the main operating system (OS) that can be used. Imagine a version of Windows tailored for high school teachers, a different one for senior citizens, one for bankers, etc. 

The general purpose OS for the Pi is Raspbian. For those familiar with Linux or even Windows or OS X, it will look familiar (what you see above). If you plopped  most people in front of a monitor showing the above, they could figure out what to do within a few minutes. But what can you do without a monitor?

The Headless Horseman

As with any computer, the Pi can be run "headless", in other words, without a monitor. While it requires that the Pi is connected to your home network and that you know how to find its IP address. You also need to know how to use SSH and VNC on another computer. There are plenty of sites available to help you. Here is a good one. This is the main use of my Pi so that I can listen to internet radio stations like Xponential Radio and WQXR2 (Living Music, Living Composers).

A New SD Card, a New Computer

What is also nice is that the OS is stored on an SD card. That means that you can easily swap cards and have another OS for your Pi. One that I am currently trying is one that make your Pi a high-end audio server. While it is still in the development stages, it has promise, and when I want to do something different, I just pop out that card and put in another one.

Another use for the Pi is as a video media server. Since it has an HDMI output, you can connect it to any TV with such ports. One such distro is Raspbmc. I have not tried it yet since I am still in the stone ages with TV (it's a CRT). You can see a list of other distros can be seen here.

It can be hidden.

One last use that I want to mention. Since the Pi is small, it can be tucked away in the corner of a typical academic office and not noticed. I did that to a colleague, and attached some old computer speakers turned up loud. Since the Pi was connected to the school's network, I could control it from my laptop in my room at the other side of the building. At a time when I knew he was alone in his office, I started the Pi playing some hideous Christmas music. After an initial fright, he knew who to blame. At least he didn't crush the Pi.

09 November 2013

The Crusher

DSC_0304


Every year, on the Saturday before Thanksgiving, the Western New York Physics Teachers Alliance (WNYPTA) puts on its Physics Olympics for area high school and middle school students. We try to make it a low-key affair (one member calls it "the anti-Science Olympiad").

The Crusher

One of the traditional events at the Physics Olympics is the structure building contest. The actual structure changes from year to year. We have built bridges, cranes, towers, and cantilevers with the usual craft sticks and hot glue or sometimes with straws and toothpicks or other material. What I want to share on this blog post is how we test-to-failure some of these structures. Years ago, we used the usual low-tech methods like hanging a bucket from a bridge and gradual filling it with water. While time-honored, I wanted to add a little razzle-dazzle to the event. So I made the Crusher (seen below with the latest version at the end of this blog).


P1100839

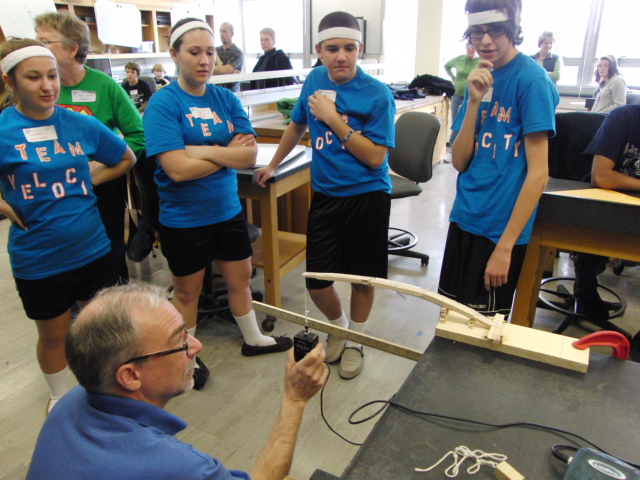
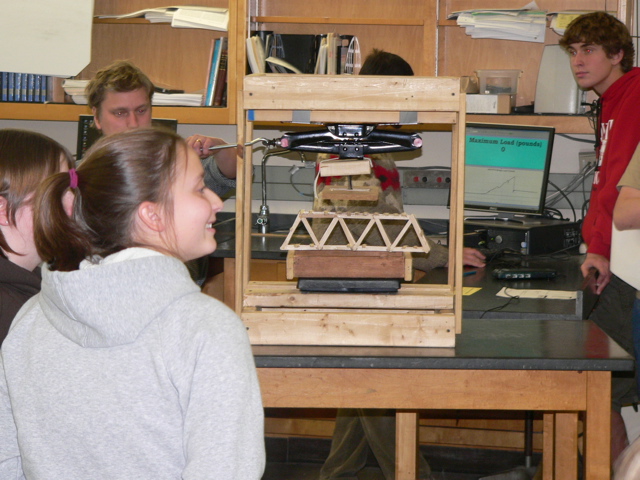
The Crusher is a simple structure; it is just a crate that holds a Vernier Force Plate on the bottom and the loading mechanism above. That mechanism consists of an old scissors car jack with a swiveling plate below (to make sure that the load is applied across the structure even if it is not built perfectly level). With a computer running Vernier's LoggerPro software and projecting to a screen at the front of the room, the entire room can watch the as the load is increased until failure. You can see an example in the background of the above picture. And we can print out the graph for the team to bring back to school for bragging rights.  However, there was one detail that took me a while to figure out.

The Razzle-Dazzle


The one detail that I wanted for the display was to have the Maximum Load shown. The problem was that meter-display box would show the current load. Once the structure was compromised, the display would not show the maximum. However, after a couple hours of trying various settings, I figured out what to do. I include the details below for those readers who use Vernier products and who might want to do similar.

First set up two pages in LoggerPro. One page will have the raw data in spreadsheet form. Add a "calculated column" which stores the maximum value of the "Force" column. On the second page, add a graph of the Force and a meter showing the Maximum Force. Here is what took me a few hours to figure out; there is an option under the "Experiment" toolbar called "Live Readouts". When zeroing-out the Force Plate when the structure is placed on it, the "Live Readouts" options has to be enabled, but then it has to be un-enabled when the load is being applied and until after the print-out of the graph has gone through. If you are successful, you will get a page showing something like below.

If you are interested in using this setup in your classroom or extra-curricular activity, I am willing to share the LoggerPro file.  Just email me at the blog's associated address.


More Razzle-Dazzle

This year, I am going to add a new component. Vernier's DataShare feature (which I have written about before) will allow me to broadcast this graph to those students (and parents) who have smart-phones with a web-browser.


Here is an example of the WNYPTA cantilever event from 2011 using the same LoggerPro setup as above but with a Force Sensor instead of the Force Plate. The scoring for this event was based on the product of the lever arm distance and the maximum load. By inserting a Parameter Control, I can input the length of the arm and LoggerPro will calculate the above product and display it for all to see up front.


CIMG0983l


The Crusher, 2nd Modification


You might have noticed a major problem with the version of the Crusher shown above; it applies the load to the top of the bridge. One of my projects this summer was to modify the Crusher to apply the load to the deck of the bridge so that I can use it in the Intro to Engineering course I am teaching this year. You can see that major modification below. In essence. I just added a removable rod that can go through the bridge and apply the load inside.


Here are some hints if you want to build one of your own.

Bill of Materials

Scissors Jack
     you can borrow the one from your car or find one at a junk yard for $5-10

Top and bottom plates
     I modified an old teacher cart in the example above, and have used old pressboard from an Ikea desk for another, but you can make yours with some scrap plywood and scrap 2x4 lumber screwed in at the corners to attach the pillars.

Pillars
     hockey sticks are used here simply because I had a number of them available, but you can use 1x3 or 2x2 lumber available at your local hardware store. If you have four 2-3 foot long 2x4’s lying around, you could use those also but the structure will be heavier. Start with 3 foot lengths since you can raise the Force Plate with books if needed. You can trim them later when you have a better idea about what height you need.

Load Frame
     the lumber you use for three parts of the frame (the horizontal member attached to the scissors jack and the two vertical members) can be the same that you use for the pillars, however, the lumber you use for the load member you need to choose with care. It, along with the Load Foot (see below), need to be small enough to pass through the bridges you are having your students build. For the bridge I show in the photo, the pass-through is about 2 inches square. I hold the lower member to the load frame with steel and magnets to facilitate easy disassembly, but you could attach with a couple of rubber bands.

Load Foot
     If you want to exert the downward force on only a small portion of the structure, you will need to affix a load foot to the lower load frame member. I have used the swivel head of an old C-clamp to allow the load foot to compensate for less than level bridge decks. The car was added just for whimsey.

Structure Supports
     If you want to specify a bridge-span wider than the Force Plate, you will need to tack together a simple frame. Easy enough to do with any scrap you have around.


21 October 2013

Don't Text and Drive


There are certain classic physics labs. The ruler-reaction time lab is one of those. It is simple, requires little equipment, but gives students something they can relate to. 

Good Artists (Teachers) Borrow, Great Artists (Teachers) Steal


 A while ago, I saw on my Twitter feed a picture from a teacher who does a variation of this lab (I didn't save that tweet, so I can't properly credit that teacher). It showed students with a cell phone in one hand and their other hand waiting for the drop. So I modified that lab for my students. They went through 5 trials to get a reaction time with no distractions. Now comes time for the distraction.

I can use a cell phone in class?

While I had my guys, working in teams of three with one being tested and one dropping the ruler and one receiving the text message from the testee, using cell phones, I realize now that any active distraction will do. I could even have them using calculators. What matters is that the brain is trying to actively focus on two things at once. I could have the third team member ask the testee to use a calculator to calculate something "What is 5+7-5*25.......no I meant 23+3.....".


The results were as expected; the average distracted reaction time is more than the undistracted reaction time. And most students will see their distracted times more deviated than the undistracted times. The lesson here is that while you might get away once or twice with texting while driving, you cannot always count on a good reaction time.

06 October 2013

Why I still use WinPlot

Why I still use WinPlot (even on my MacBook)

WinPlot has been a major tool for me for more than 15 years. When I want to add a graph or a set of axes to a test or homework, it is my go-to app. It has the perfect combination of ease of use and lots of features. I have written a couple of posts on WinPlot before (here and here). However, when my school changed the teacher laptops to MacBooks, I couldn't take the program with me.

My requirements for a replacement are basic. I want to make graphs of functions (sometimes piece-wise), change the scales on both axes independently, and label the axes with appropriate units. An example is below. I knocked this one off in about 10 minutes for my AP class. I wanted to give them some idealized elevator acceleration data they could practice with so that they might be able to do something with the messy data they got. Note the labels for the y-axis and the x-axis.


I have looked for such a program for my MacBook, but have not found one as flexible. The app Grapher that comes with OS X does not have all the flexibility needed. I even looked at using gnuplot, which I consider the Ferrari of plotting programs. However, since I would be using it only sporadically, I need a GUI to help me navigate all the available options. Haven't found one that works on Macs.

Bottle that Vintage

My OS of choice at home is Linux. And so I am familiar with the Wine project. It allows one to run many Windows programs in Linux. And since the latest Apple OS's are based on Linux, there is hope. I could have delved in the back room of the Terminal application, but I came across something better.

Wine Bottler is a program that takes a Windows program and makes a Mac app for you. You can then run them just like any Mac app (with some limitations). It was easy to make a WinPlot app that runs just fine on my MacBook. I can run it just like I did a few years ago. But there is a price. While I could just copy-paste the graphs between programs in Windows, I can't do so with the Wine-Bottled versions. I just have to save the graph as a graphic file and then import that file into the document I am creating.

Another price is that the apps made by Wine Bottler are bigger than the native version and you have to have the X11 app installed. But if you have a favorite Windows program and want to find a way to run it in OS X without installing Parallels, you might want to check out Wine Bottler.

02 August 2013

If I Play Long Enough, I Gotta Win, Right?


The probability of winning the PowerBall  multi-state lottery with a single ticket is 1 in 292 million. In another post, I describe a way of visualizing these odds. But what if you played 175 million times? Your sure to win, right? You would if you could buy tickets for all 292 million possible number combinations, which would require you to have more than 500 Lottery terminals printing out one ticket a second for the 4 days between drawings. Oh, and you would need $400M to pay for them. 

I'll just play for 292 million weeks

I know I am going to live forever, or at least 292 million weeks, so if I play one ticket a week, I have got to win at least once. Let's figure it out.

As with many probability questions, it will be easier to calculate the probability of not ever winning. Since it is possible to win more than once, you would have to calculate the probability of winning exactly once and losing all the other times, then of winning exactly twice (and losing all the other times), and so on.

The probability of winning with just one ticket is 1/n (I will use n instead of 292,000,000 from now on), and so the probability of not winning is (1-1/n).
The probability of not winning two weeks in a row is then (1-1/n)*(1-1/n), of not winning after three weeks is (1-1/n)^3, and of not winning n weeks in a row is (1-1/n)^n.

When I try to use my calculator to figure out the above for n=292,000,000, it breaks. However, I remember something from my calculus courses.

So, when n=292,000,000, (1-1/n)^n is very close to 1/e. 

Since the probability of not ever winning the PowerBall after playing 292 million times is close to 1/e, the probability of winning at least once is 1-1/e or about 63%. So even if you play that many times, you still have about a 1 in 3 chance of never winning the big prize.

  So I'll just but all 175 million possible combinations.

If you bought a ticket for every single possible combinations of numbers, you would be assured of winning. So, how long would it take to do so? Assuming that you could get one ticket ever second (and that you had $400 million to do so), it would take over 2000 days at one terminal. Since there are only 3 days between drawings, you would need to need to use over 700 terminals just to get all the tickets printed (assuming that you already had all the necessary cards filled out that you need to get specific combinations, another 2000 days of effort). But, you are determined and do all of the above. You are guaranteed to win, but someone else might also, which then cuts the payoff in half (or thirds, or quarters). And have you factored in the taxes?

23 June 2013

July 3rd is the Shortest Day of the Year


21 June is the longest day and 3 Jul is the shortest.

Many people consider the first day of summer to be the longest day of the year (if you count just the daylight time).  But did you know that 3 July can be considered the shortest day of the year (and this year it is the 54rd anniversary of WWVB)?

How long is a day?

Ask someone how long a day is and you will probably get the answer, "24 hours". However, ask someone at the US Naval Observatory (and at WWVB) and you will get "9,192,631,770x60x60x24 cycles of the standard cesium-133 transition". Ask a farmer and you will get "From sunup to sunset". We have any different definitions. For this post, I am going to use the synodic definition, the time it takes the Sun to go from due south (local solar noon) to the next time it is due south for an Earthbound observer

It starts with Kepler.

 Thanks to Johannes Kepler, we know that the Earth orbits the Sun in an eliptical orbit, and that the Earth is moving fastest when it is closest to the Sun (perihelion) and slowest when it when it is farthest (aphelion). 

This year, aphelion occurs on 4 Jul at 12:24 EDT, which will be the shortest day of the year. 

Let's figure it out.

Since on the above diagram, the Earth is also spinning counter-clockwise, the diagram below shows (with the added lines) one complete rotation of the Earth for both the day of aphelion (3-4) and the day of perihelion (1-2).


Notice that it takes a little more than one rotation of the Earth to have the Sun directly due south again. Also notice that the Earth has to rotate a little more at perihelion than at aphelion to be facing the Sun 1 synodic day later.  So a synodic day is shortest at aphelion.

But how much shorter is it?
  
While the above argument is enough to show that 4 Jul 2016 is the shortest (synodic) day of the year, it does not say by how much.  Is it minutes or milliseconds? To answer this, we will need some numbers and the more precise form of Kepler's Law used above.  Kepler figured out that orbiting bodies sweep out equal areas in equal time. And by looking at the diagram above, you can see that the angle swept out by the Earth in one sidereal day is equal to the extra angle the Earth has to rotate to get the Sun due south for an Earthbound observer.

Since the area of a circular sector is
this gives the relationship between for angles swept in equal time.

The Earth-Sun distance is 152,098,232 kilometres (or 1.01671388 AU) at aphelion and is 147,098,290 kilometres (or 0.98329134 AU).  This gives

 Microseconds or Hours?

So, the Earth rotates around the Sun just a little bit less on 6 July than on 4 January. Since the Earth rotates about 1 degree (actually 360/364 degrees), it rotates about 0.033 degrees less on 5 July for 1 synodic day than on 4 January. How long does it take the Earth to rotate that angle? Since it takes 24 hours to rotate 360 degrees, it takes about 8 seconds to rotate that 0.033 degrees. So the synodic day on 6 July is about 8 seconds shorter than the synodic day on 4 January.

Classroom use.

Unless you are teaching summer school, this is not much use in the classroom.  However, if you flip the seasons, you can show that the day of perihelion is the longest day of the year (and it is close the the "shortest" day of the year, 22 Dec). Since the first day back from the Christmas break is close to 4-5 Jan, I use this for a gradual welcome-back class.  In a regular physics class, we just do the qualitative approach with students playing the parts of the Sun and the Earth.

The discussion starts with what causes the seasons.  It helps to have a globe handy at this point. We then discuss Kepler's laws. I get one student to play the part of the Sun and one the Earth.  Depending on time, I might have the class discuss how the Earth should rotate (the Sun rises in the east). If not, I will just get the Earth rotating in the correct way.  The class decides when the Earth has rotated one complete rotation relative to the room and then notices that it is the Earth (the student) is not facing the Sun. That 5 minute activity sets up the above discussion.

A related post (http://canisiusphysics.blogspot.com/2013/03/if-spring-starts-tuesday-why-does.html)


24 May 2013

I am glad we don't do Regents

Here is a recent letter concerning Regent Exams and a teacher's SLO score (forgive the formatting; it is copied from a PDF).


May 24, 2013
Dr. John B. King, Jr.
New York State Commissioner of Education
New York State Education Department
89 Washington Avenue Albany, NY 12234

Dear Commissioner King:

I am writing in response to Ken Slentz’s letter of May 22, 2013, in which he attempts to clarify some of the questions and concerns still remaining around the scoring of SLOs. While the memo might have sought to clarify, I assure you the field questions SED making this change particularly this late in the school year. The SED memo contradicts previous guidance on this issue to practitioners. This latest change in direction is yet another example of the Department’s failure to communicate with those most directly impacted by the changes. The lack of professional regard for practitioners is apparent, further eroding the tenuous relationship SED has with those in the field. As to NYSUT’s concerns: The understanding in the field since September, based on SED guidance, was that if a student does not sit for a Regents exam, there would not exist a second set of data from which to calculate a growth score for the student and, therefore, the student would not be counted in a teacher’s SLO. SED has now made a distinction between being absent on the day of the assessment and not qualifying to sit for the exam. This distinction is contrary to how these students are treated on the New York State School Report Card Student Performance Science Regents Data. This new determination will affect science teachers exclusively. SED’s letter states that students who do not qualify to sit for a Regents exam because they did not meet the minimum number of required lab hours would still count in a teacher’s SLO HEDI results. In this case, the student would receive a ‘0’ and that ‘0’ would be factored into the teacher’s final summative SLO rating. This rule puts Regents-level science teachers at a huge disadvantage across the state because they are the only group of teachers with a mandatory lab requirement. Only science Regents courses have a qualifying requirement that is out of the teacher’s control. A student could be failing other courses and still take the Regents and possibly score well. The science students who don’t qualify because of the lab requirement might be passing the course, and if they were permitted to take the Regents exam, they might do well.


Assigning a zero to something that was not completed unfairly skews the statistical results that are so important to accurately measure the variable at hand (in this case teacher effectiveness). A student who fails to meet the qualifying lab requirement is disqualified from demonstrating his/her knowledge of the subject content and that disqualification now requires the teacher to receive a ‘0’ for that student’s score. The ‘0’ says nothing about the teacher’s effectiveness because there is no assessment to measure student content knowledge. It is based solely on a student meeting the lab requirement. SED guidance on SLO’s has been lacking in detail, and much of the responsibility for the SLO process has been passed to districts. It is no wonder that this “rule” has the field up in arms as it conflicts with SED’s limited guidance on SLOs (revised March 2012) which states that SLOs must measure two points in time for the same student. More recently on the EngageNY web site, the May 9 webinar (http://www.engageny.org/resource/slo-results-analysis-webinar) states in at least three places that a student must have two data points – a pre-assessment and a postassessment – in order to be factored into a teacher’s SLO. At the 10:45-10:53 minute mark, the webinar states: "Only where students do not have two scores will they be uncounted for purposes of calculating (SLO) outcomes." If a student does not take a post-assessment, then she/he will not have these two data points. Throughout the guidance, there is no distinction made between the reasons for not having two scores, and there is no reference to not qualifying to sit for the assessment. To further support the understanding in the field, at the May NTI training, a BOCES NTI team determined that they all had similar interpretations of the issue and shared the following on the Science listserv: “Our best thinking is that the language states that calculating the SLO requires data from two points in time. If students cannot sit for the exam, they are not calculated in the SLO.” SED goes on to say, in their letter to NYSUT, that it is the responsibility of the teacher to ensure that all students meet the lab time requirements so that they are able to sit for the Regents exam. This statement shows the gross lack of understanding of the fact that often the teacher of the Regents course is not the lab teacher. The letter further states that, “The Department recommends that districts/BOCES create processes that ensure students have opportunities to make up lab requirements.” Again, SED seems to be unaware of how districts schedule for these labs and the resources they provide to students throughout the year. Districts build into the school schedule more than the necessary minutes to meet the lab requirement of 1,200 minutes. Teachers offer make-up lab times to students during study halls, lunch and after school. The reasons students do not meet the lab requirement are predominantly out of the control of the educator.

SED is instituting a policy change at the eleventh hour that contradicts their own guidance. This places science teachers in New York State at an unfair disadvantage. There is a readily available solution: Students who do not qualify to sit for a Regents exam because they did not meet the minimum number of required lab hours should not count in a teacher’s SLO HEDI results. To say that teachers are dismayed by this latest reversal in policy would be a gross understatement. This takes the already strained relationship that exists between SED and practitioners to a new level. Our intent with this letter is, to once again, urge SED to exercise common sense. NYSUT urges SED to re-evaluate this latest change and make it consistent with all previous guidance.


Sincerely,

Maria Neira c: Members of the Board of Regents Ken Slentz, Deputy Commissioner


23 May 2013

How the Many Worlds Interpretation of Quantum Mechanics Almost Cost Me my Job


End of the Year

Time permitting, I like to end the academic year with Special Relativity with an emphasis on how it allows time travel. We then watch the Nova episode Time Travel with Kip Thorne. One segment uses the Many Worlds (MW) interpretation of Quantum Mechanics to suggest that the single-photon double slit experiment shows that time travel is possible between parallel universes.

DAVID DEUTSCH: The photon that we can't see is a photon in a parallel universe which - a nearby parallel universe which is interacting with the photon in our universe and causing it to change its direction. The result of these single photon inference experiment is the strangest thing I know. It is conclusive evidence that reality does not consist of just a single universe because that result could not come about unless there were another nearby universe interacting with ours.
NARRATOR: If true, this idea has profound implications for time travel.
DAVID DEUTSCH: When one travels back in time one does not in general reach the same universe that one starts from. One reaches the past of a different universe.

To illustrate MW (that when an action has different possible outcomes, the universe splits so that each possible outcome happens in a different universe), I grab a ball from my desk, wind up, and "throw" it at a student (I actually drop it behind my back). There is a collective gasp and then relief that no ball was thrown. I then tell them that according to MW, there is a universe where I did throw the ball. We all giggle a little and move on.

This year, in my last class, the ball didn't drop behind me. Fortunately, I narrowly missed a student. After a moment of shock and then profuse apologies, I got back on track and said "In another universe, I didn't miss. (pause) And I am now being lead away in handcuffs. (pause) And because I can't grade your finals, you all get 100's."


Next year, I'll use a foam ball.


many_first_world_problem


18 May 2013

Not Taylor, but Cordic


There are certain "Wow" moments in the education of a mathematics student. For me, they include Cantor's discovery of different levels of infinity, Gödel's Incompleteness Theorem, and the Lancaster War Model. But on most student's list will be the Taylor Series.

 Geometry and Arithmetic

To see that a geometric quantity (the sine of an angle of a right triangle), the ratio of two lengths, can be calculated with an arithmetic formula is astounding. And to implement this formula with only a few lines of computer code boggles. It is then tempting to assume that this is how your calculator does its calculations. And it probably would be except for one fact; your calculator is dumb.

Addition is easy, Multiplication is Hard

Since a calculator at its core uses binary arithmetic, it can easily do addition. You probably learned how to do it grade school. But multiplication is harder, with one exception. It is easy to multiply by 2 (10 in binary). Let's look at a simple example, 5 x 2 = 10. In binary, it is 101 x 10 = 1010. To multiply a binary number by 2, all you need do is shift the digits to the left, and shifting bits is very easy for a calculator's CPU to do.

The problem with using the Taylor series is that calculating just the first 5 terms of the sine expansion requires more than 50 multiplications and divisions. However, there are other ways of calculating the sine of an angle that, while harder for humans to do, are easier for computers.

COordinate Rotation DIgital Computer

An alternate method of calculating sine (and other transcendental functions) was developed in the 1960's that uses multiplications and divisions by 2. The details are beyond the scope of this post but can be found using the links below. At its heart is the decomposition of the angle into the sum of a set of specific angles.


Going from one angle to another is thought of as a rotation in space. The angles are picked so that the rotations are easy for the computer to sequence and calculate with. While the CORDIC algorithm was developed for early binary computers with limited core functionality, it has been adapted for calculators as evidenced with this from Texas Instruments

 Past threads on Graph-TI asked about the internal methods
     used to compute trigonometric and other transcendental functions.
     We wanted to add some specific information to this dialog so that
     someone could perhaps develop a short module for the classroom if
     they would like.  This topic should be interesting for background
     on calculators or as a good example of a math application.

     Most practical algorithms in use for transcendental functions
     are either polynomial approximations or the CORDIC method.  TI
     calculators have almost always used CORDIC, the exceptions being
     the CC-40, TI-74 and TI-95 which used polynomial approximations.
     In the PC world, the popular Intel math coprocessors like the
     8087 use CORDIC methods, while the Cyrix 83D87 uses polynomial
     methods.  There are pros and cons to both methods.

The details of CORDIC can be found at various sites with a few below. 

Links

A paper on the CORDIC algorithm for the general student (from the site that hosts WinPlot which was used to generate the opening graphic)
http://math.exeter.edu/rparris/documents.html
http://math.exeter.edu/rparris/winplot.html
Sadly, Mr. Parris passed away a few years ago.  The school recently de-activated his account.  The paper can now be found here.

A paper from the Texas Instruments Calculator division about how their calculators use CORDIC
ftp://ftp.ti.com/pub/graph-ti/calc-apps/info/cordic.txt

How CORDIC was implemented on the HP-35 with details on the bit-shifting operation
http://www.jacques-laporte.org/Trigonometry.htm

The ubiquitous Wikipedia entry
http://en.wikipedia.org/wiki/CORDIC

12 May 2013

A Kvetch


The Technology Treadmill


And so another major change is coming my way. For years, we have been using Moodle as our classroom management system. Most teachers in our school just used it as a way for students to get materials they missed in class while some teachers were more advanced and used it to collect and grade some assessments.

A handful of us used Moodle to administer (and grade) multiple choice quizzes and tests. It allowed the randomization not only of the answers within each question, but also the randomization of the question order for each student.  Administration encouraged that use because it would reduce the use and purchase of the "bubble sheets" we use (at about a nickle each). 

Knowing that I would have such questions available for years in the future, I willing spent 5 to 15 minutes crafting each appropriate multiple choice question (see a previous blog post on that). Some of those questions had graphics in the question text and also in the answer choices. I also spent hours figuring out the Moodle way to include a semi-random number generator in my question text and how to craft appropriate formulae in the answer text, so that each student would see the same question, but with different values. For example, I could ask a typical optics question of calculating the image distance given a focal length and an object distance where the givens are random multiples of 10 or 20. I now have a growing collection of MC questions appropriate for my classes.

Just recently, administration has let loose through the grape-vine that we will be switching CMS's to Schoology. No teacher input. While it is claimed that the switch-over will be gradual (over the next academic year) and painless (supposedly we can just copy over our material from Moodle directly into the new), veteran teachers know that such major changes rarely go as smoothly as is claimed.  

I have had a brief chance to try the new CMS, Schoology. My first impression is that Schoology is designed to be easy for the 95% of teachers who use only the basic features. And that is where they are spending most of their development time. That makes sense for a commercial product. 

However, our old CMS (Moodle) is open-source and community supported. There are a large number of outside developed modules that vastly extend the basic product. For example, one person decided that it would be nice to be able to insert Geogebra interactive graphics easily. So that person spent some time, wrote a module to do so, and then offered it to the general public on Moodle. The Schoology is closed-source. So any new feature has to be begged-for and the company has to decide if it makes economic sense to work on that feature.

It is like the difference between Linux and Microsoft Windows. MS is easier to use, however, Linux allows you to do what you want to do if you are willing to spend some time modifying things. Windows is nice for the 95%, but Linux is better for ultra-power-users. And Linux users like to show off and share. Moodle is like Linux. Schoology is like Windows (or even worse, Apple).

For example, there is a very powerful feature in Moodle that allows a teacher to make a quiz with questions using random numbers or numbers taken from a dataset. Here is an example. "How far does a car go when it has a speed of 'x' m/s and travels for 'y' minutes?" I can chose to let 'x' and 'y' be completely random numbers, or random numbers in a set range, or numbers chosen randomly from a list I specify. Obviously, this feature is of interest almost exclusively to teachers of the mathematical sciences. It took me a while to master the syntax needed for these questions, but I found that feature a helpful one. I could tailor my online quizzes according to my educational philosophy on such assesments. Several people have asked for such a feature on Schoology for over a year, but there has been no response from the company. So, for me, a critical feature is no longer available.

Since it seems that the switch-over is going to happen, I tried the new site. Trouble. Quizzes transfered over with graphics only in the question text. No graphics in the answer choices. I also have several practice quizzes that were made as websites. As such, the files for question pages and answer choices have to have a specific file structure for the links to work. All the quizzes and all their supporting files were dumped into one file folder. The links are borked. So I will have to waste several hours recreating content instead of enhancing it. I haven't even looked at the questions where the answers are generated from a random value given in the question and an appropriate formula in the answer text.

I don't have high hopes that these problems will be fixed when we officially switch over. I am the only one at my school using these advanced features of our current CMS. I am sure the company at Schoology will look at the problem and then issue a shrug of the shoulders. It will be left to me to sort things out. So, instead of writing new questions that try to get students to think before reaching for a calculator, I will have to rewrite the old ones and try to figure out the Schoology way of doing things.

Frustrated teacher

There is one concession to my plight. Through a grant, my school is hosting a weeklong summer work session for a core of teachers to pilot this new CMS. We will get together and try things in a workshop setting, and we will get a stipend. So at least I will get some monetary compensation for my pain. I hope it works out to at least one-tenth minimum wage for all the time I will have to spend implementing the change-over.
  

Addendum

The new CMS company does have a support site. I looked there to see if other users had some of the same concerns as I. Some do, however, it has been over a year since the first request was made for the random number use in quiz questions. Nothing yet. I have no hopes for the future. I


28 March 2013

Optics and the Caveman Brain

You see with a Cave Man Brain


Ray-tracing in optics is one of those skills that is enjoyable to teach in class. A simple procedure, but with powerful results. Every year, I see a couple of students who struggled with the algebra of motion analysis who get a sense of accomplishment when mastering this technique. However, a few years ago, I noticed that many students seem to believe that the rays stopped at the image location. That is when I introduced the Giant Eye and the Caveman Brain.


I now start optics with a simple description of how the eye-brain combination works, that our brain has evolved to instinctively know that light has traveled a straight-line path from object to our eye. To illustrate, I get two volunteers to play a caveman and a fuzzy bunny.


We discuss the role of sunlight in seeing, how light reflects off the fuzzy bunny and goes in a straight line to the eye of the caveman. What would happen if the caveman's brain told the caveman that, while the light from the fuzzy bunny came from in front of him, the fuzzy bunny is over to the right? I have the caveman then throw a "spear" over to the right. I ask the class if this caveman will get to eat tonight. What if the brain told the caveman that the bunny was in the same direction that the light came from? The class caveman then throws the "spear" and "kills" the fuzzy bunny (a chance for some hammy acting). Caveman gets to eat tonight! And since I was on a roll, a couple of years ago, I added "Caveman makes fuzzy bunny slippers. Caveman gives to to cavewoman. (slight pause) Caveman pass on genes!"

While the actors are getting back to their seats, I emphasize that evolutionary pressure has made it so that we instinctively know that the light that enters our eye has traveled a straight line from object to eye. That lesson seems to help students understand lens and mirror optics later.

14 March 2013

If spring starts Thursday, why does Tuesday have 12 hours of daylight?

17 Mar has 12 hours of daylight, but spring is 3 days after. Why?

Why is the Vernal Equinox confusing to students of Latin.


Ask most people what happens on the first day of spring and you will get "12 hours of daylight and night" (i.e. equinox), which is close but not quite right. Some might say the northern hemisphere of the Earth is neither tilted away or toward the Sun. A few might even state that on that day, the equatorial plane of the Earth crosses the center of the Sun. However, these last two explanations, while correct, don't explain why the first day of 12 hour-daylight happens a few days earlier.

sunrise earth

The way I use in class to explain what is going on is to say that on the day of the vernal (or the autumnal) equinox is when it takes 12 hours for the center of the Sun to cross the horizon in the morning to when the center crosses the horizon in the evening. Since we start counting daylight when the first part of the Sun peeks above the horizon to when the last part of the Sun goes below the horizon, it becomes obvious that the day of the "equinox" will not really have equal day and equal night.

Please note that 12 hours of daylight happens on different days depending on how close you are to the equator (the closer, the more ahead of the the Vernal Equinox you will get the true equinox).


02 March 2013

His contribution to the world, WinPlot


Richard Parris, someone who made a difference

As educators, we have a list of colleagues we admire, ones we know from experience make a difference.  Your list probably includes some teachers from your school and maybe from your school district. If you are fortunate enough to be able to attend many professional opportunities, that list includes some people you see only occasionally. And we may admire ones we know only from blog posts or tweets. For me, Rick Parris was in that last category.


Peanut Software

I first encountered Mr. Parris when, in the early 1990's, I was looking for a way to include digitally-drawn mathematical functions in tests and quizzes for a calculus class. I came across WinPlot. It had the nice compromise between small program size and ease of use, and number of features. It became a favorite tool when I was finishing up my graduate work and teaching as an adjunct at a local college, looking to impress the "real" professors. 


When I started my present job, I brought that tool with me, using it when I taught calculus and trigonometry classes. I noticed that Parris listened to feedback from users and made frequent updates. At one time, I wanted to create graphs where the axes are scaled in multiples of pi. So, with a few emails and a couple of weeks, that feature was added. Try doing that with a suggestion for a MicroSoft product. I wrote about using the program in an earlier post.

What is done regularly, is expected

I got used to the regular attention that Mr. Parris paid to WinPlot. I would check every so often to get the newest update. Recently, I noticed that he hadn't updated the program for a while. With a little bit of searching, I found that he has passed away. My heart sank. Someone who created a tool to help students, then noticed that fellow teachers could use it, then made the time over many years to make many changes that others wanted, is no longer with us. He will no longer be able to make WinPlot better. The education world is richer because he cared and poorer now because he is gone.
  

Addendum

I recently contacted a friend of mine who is now at Phillips Exeter where Rick Parris taught. There are no plans for anyone at Phillips Ex to continue with WinPlot or any of the other programs Parris wrote. I do not know how long they will be available (my guess is that the school's IT department will deactivate his account this summer). Even if you have no need now, you will want to download and try his programs here. There is much educational value here. You will find he will help you in your teaching mission.


Update

It has been a year since the death of Mr. Parris and the website is still active. I hope Phillips Ex keeps it going as a tribute to his life. 


21 February 2013

My School has a Fantastic IT Department


Do they work with you or against you?


Networked computers are a fact of life in the modern classroom. However, many schools put barriers in the way of a teacher who wants to try new software or add new features. Most schools I know of have a "locked-down" policy for their school issued computers. Any new software or modifications of features requires official permission. Some schools will process requests with glacial speed and others schools will  so in a few days. One district in my area erases and then completely re-images the hard-drives each evening. I know of one teacher who was almost fired because, in his enthusiasm to share with his students the neat things that could be done with an iPad and Vernier's Video Physics software, downloaded a $3 app without prior approval (fortunately his principal came to bat for him, but I am sure that there is a "letter in his file").

Each time I hear about another school's restrictive policies, I am grateful for my school's IT staff.

Trust the Teachers

I have just finished installing Linux on my newly-issued MacBook. This is the third school-issued computer that I have done this on. Each time I have asked permission from the IT head, expecting a polite refusal, but the only restriction I have received is that they would not be able to give me support for it. It does help that the IT head is something of a penguin-head himself and knows that there is a world beyond the Win-Mac duopoly. 


Geek Hero Comic – A webcomic for geeks: FOSS Windows

Why Linux?

As someone brought up with the Unix ethos of hack-able software (in the original sense), I have valued FOSS (free and open-source software). Linux is built on that ethos. I try to show my classes that philosophy also. When we do linearization of data using spreadsheets, I demonstrate with Gnumeric. When we study sound, I show them what Audacity can do. If I have enough time, I like to use Audacity to show how to rebuild a sound using only sine-waves (a reverse FFT). To do that, I had to take the source code and make a minor modification. Had that code not been available, I would be at the mercy of what the programming team thought I wanted to do. Here is the ethos at work; here is my work, use it, improve upon it if you want. 

graph displaying the relationship between Freedom and Responsibility

With Freedom comes Responsibility

Since I am trusted by my school's IT head, I do not want to betray that trust. So there are certain things that I could do that I will not do with school computers. I would love to jail-break my iPad to circumvent Apple's "do it our way or no way" mentality, but that might expose our school to legal problems. The same with using "abandonware". OK, once I used some cracking software on my laptop to recover a forgotten administrator password, but it was with an unofficial blessing, otherwise my computer would have to have been completely re-imaged, wiping out all the added programs and customizations.

It is more work for them

I am sure that a totally locked-down approach to school-issued technology would make my school's IT department's job much easier. But they have adopted the philosophy of letting the teachers deciding how they want to use their technology. We are then able to show what we have discovered with not only our students but also with fellow teachers. This policy lets us be more spontaneous and innovative teachers. For that freedom, I am thankful.