MathJax

20 December 2012


The RaspberryPi is one of those things that captures the imagination of some people. While many people are using it for useful purposes, I have decided to use mine for nefarious ones.

I have set up a Pi on our school's network, but in the office of the faculty member who has the responsibility for training the rest of us in technology use. I will sneak into his office early Friday morning and attach some speakers to the Pi.

Since I can access this computer from my laptop, I will start to play some songs from the Bob Rivers site at what I hope will be a semi-inappropriate time.

14 December 2012

The Roller Coaster and the "Natural Path"


A classic example for HS physics teachers when discussing circular motion is the roller coaster loop. And the classic difficulty is getting students to understand the role the track plays in exerting force on the roller coaster car. To help with that, I have developed the idea of the "natural path".

After the basic discussions of circular motion and the emphasis that the force needed for circular motion  is not a real force, but the result of other real forces (I seldom call it centripetal force), we go to the roller coaster. However, I start with a typical loop cut in half vertically. We discuss what path a car would take when it came to the top of the loop and flew out into space. We get the typical projectile path. We draw one for a car moving at high speed and then another for one moving at low speed. I call those the "natural paths" that the car wants to follow.


I then draw in the rest of the coaster loop. We look at the high speed case and note that the natural path lies outside the loop. What prevents the car from following its natural path? The track. It must exert a force downward on the car to make it move in a circle.


We then look at the low speed case and see that the track must exert an upward force to keep it moving in a circle. We discuss what a rider would feel for each of these cases, with my in-class examples all starting with a roller coaster engineer specifying the force she wants a typical 75 kg rider to feel and then calculating how fast the car has to be moving to satisfy that requirement.

So, what will you feel?

Now comes the task of getting students to understand what the roller coaster passengers will feel. It starts with what they are feeling now. We talk about the forces they feel as they are sitting on the classroom stools. We decide that "normal" is when they feel the seat pushing up against them with a force equal to their weight. It usually takes some more discussion to get them to realize that they would feel "normal" when something is pushing against their butts, whether is it up or down. So, when the track (and thus the seat) is pushing with a force against your butt, you feel attached to that seat; you don't feel like you are falling. If that seat no longer pushes against your butt or is even pulling your butt down, you no longer feel attached to that seat; you feel like you are falling.

rollercoaster boy in a hand drawn cartoon style. Stock Photo - 5673112

For advanced students

If you have students with a good calculus background, you can have them compare the curvature of the natural path to the curvature of the loop. And they can then calculate the force exerted by the track from the differential equation F=dp/dt.


13 December 2012

A Use for those Old Whiteboard Marker Caps


Shoot for your grade

Many physics teachers have a variation on the "Shoot for your grade" lab. It is the lab where students predict where a marble rolling off a table will land on the floor. My variation is where the students get the speed from using photogates, essentially the Vernier-developed version, but with their target an egg. As expected, my AP guys perform better than my regular classes. However, I hope one year to have a splattered egg for each team, both regular and AP.

This year, when lab time came around for my AP class, we were in the middle of the collision section and had just derived the equations for an elastic collision with one stationary object. I came up with the idea of using one marble being hit by another as the projectile. Obviously, the case of a marble being hit by one of the same mass is trivial. Fortunately, thanks to my late father, I have a few ball bearings that are about 5 times the mass of a typical glass marble. So I have the students roll the steel marble down the ramp which will then hit the glass marble. Students first measure the speed of the steel ball at the bottom ramp using photogates and then calculate the speed of the glass marble using the analysis of an elastic collision. Those speeds are then used to determine the projectile distances of both the glass marble and the steel ball. The problem is that the balls are of slightly different radii. For a good collision, you want them to collide center to center (more precisely, you want them to collide so that the radial planes at the point of contact are co-linear). Here is where the caps come in. 


If you look carefully, you see the glass marble on the marker cap with the steel ball on the ramp. It is not a perfect fit, so the students have to shim the ramp to make the contact spot perfect.


Does it work?

As an experienced physics teacher, I know that a lab that looks great on paper can fail spectacularly in the hands of typical students.  I can report that with my AP class, all got landing spots within the max-min predicted spots with one team getting very close to the spots predicted on the average speeds.


30 November 2012

A replacement for the Lance question

What is Your Power?


In a previous post, I had lamented that I would be unable to use a standard question I like on a test. I have now found a suitable replacement.

At this time of the year, I have my students get a measure of their personal power output by running up some stairs.  While everyone gets a different result, most of my guys get around 0.5 - 1 horsepower for the 3-5 seconds of effort. On the next test, I would ask students to calculate the power output of Lance Armstrong based upon his time cycling up Alp d'Huez, one of the most famous in the Tour de France. We would then compare his 0.5 hp to the student's 1 hp, noting that his effort was over 38 minutes, whereas the student's was over a few seconds. However, with recent revelations, I cannot with good conscience ask that question again.


In my search for a replacement, I had thought about changing to a question involving a cyclist in the Mount Washington Auto Road Bicycle Hill Climb, but since many cyclists have been tainted by the doping scandal, I thought better. I then remembered the Empire State Building Run-Up. With a few minutes on a search engine, I was able to get some good data. The last winner, the 71 kg German Thomas Dold, ran the 1050 feet of stairs in 10 minutes and 28 seconds (I was unable to find weight data for the 9 minute and 33 second recold holder, Paul Crake). This will now be the basis for my new question.

23 November 2012

Why I still use the Imperial System


American Students Don't Think Metric

http://iruler.net/ruler_0_10.jpg

As physics teachers, we know that measuring and calculating with kilograms, meters, and seconds, is better than doing so with pounds, feet, and minutes. However, our country is still an Imperial one. Students have an intuitive idea that 60 mph is fast, but have no idea that 30 m/s is a little faster. For this reason, I still use Imperial units along with metric ones in my class.

There are some complications. Some students mix the systems together; others want to always convert from one system to the other. These are hassles in any class, but part of the learning process.

How much horsepower?


Horsepower


Over the Thanksgiving break, I have my students do the classic problem of calculating the average horsepower generated by a car's engine from the 0 to 60 mph time and the curb weight. We have covered work, power, and energy in class, and sometimes have discussed a homework problem where the power output (in watts) of a Porsche is calculated. Since the published data for most cars sold in the US are already in Imperial units, I have my students keep those measurements in feet, pounds, and seconds. 

The day before the break, I remind the guys that, while I have not given them a one-line formula to do this calculation, they do have the necessary tools to do a successful analysis. But, the first time or two they try, they will make mistakes. This is normal, part of the learning process. If they get an unrealistic result, they have made a mistake. Set things aside for a couple of hours or overnight, but keep thinking about it in the back of their minds. Come back to the question later and try again. I want them to make mistakes (the typical ones are using 60 mph not 88 ft/s and using weight in place of mass). About this time of year, most of my students start to understand the place of making mistakes in scientific analysis.

05 November 2012

Letting Students Discover Torque

Letting Students Discover Torque


After a couple of labs where the data was messy and students were unsure of how good their experimental technique was, it was time for a lab where things are more straight-forward and students could regain some confidence. I scheduled my "beam equilibrium lab". The set-up is simple. Take two force meters and lay a meter stick on top. A mass is then placed on the meter stick at various places and the forces are recorded. 


I usually do this lab after having introduced the concept of torque and that a static situation means that the sum of the forces is zero and the sum of the torques is zero. Students make calculations based on the static conditions and confirm them with this experiment. This year, I changed things. Torque was not mentioned beforehand.

 This year, I started by having my guys place the meter stick on the force meters at 20 and 80 cm, and then place a mass at 30, 40, 50, 60, and 70 cm. We then look for any patterns. Most see right away that the 30-70 readings and the 40-60 readings are reversed. Some will see that the close the mass is to a meter, the higher the recorded force, so it looks like how far the mass is from the support point is important. We then set the meters at 10 cm and 90 cm and place the mass at various places in between. Again I ask if they see any patterns. Some teams do, but I give the hint of pairing the force and distance measurements. After a few minutes, I can see "the light-bulb moment" for most. They are then to make predictions about what they would see when the meters are placed at 25 and 75 cm. Success! The class wraps up with a discussion of the concept of torque and that they discovered that for a system to be in static equilibrium, the sum of the torques has to be zero as well as the sum of the forces. 

Sometimes, letting your students find things out themselves is easy to do.

03 November 2012

A Wow feature from Vernier

Sharing Made Easy

Sometimes you have a demo that is tricky to set up or that requires equipment such that you can only make one setup. In the past, you would have a couple of students run it in front of the class and then share the data with the others. If you are fortunate, you could show the collected data on a big screen in front of the class where they could copy it as it comes in. But, if you want your students to do data analysis in a spreadsheet application, they would have to manually enter such. Vernier has a solution.

DataShare

The newest upgrade for the Vernier LabPro software has added a new feature called DataShare (it is also on their newest data acquisition system LabQuest2). DataShare allows any device running a web browser connected to the same network to view a live graph of the data and to download the data.

Once you have downloaded the upgrade and installed the Bonjour software that comes with (the Bonjour software interacts with your computer network, so you will want to speak to your school's network administrator before you activate the DataShare feature), you need to start DataShare.


The software searches your network and assigns an appropriate IP address that you will share with your students. Naturally, you will need to enable Data Sharing, and I suggest you disable the "remote control of data collection" unless you want your class wise-ass "helping" you.


 Once you have things running, a student just has to type your IP address into any web browser to see this.


 They can also change how they view the data.


On a computer, students can download the data for more advanced analysis.


Students can also view things with Vernier's iPad app, Graphical Analysis ($3).


 One advantage that this app has over web browsers on the iPad is that students can download the data for later analysis. I have been unable to download the data with web browser on the iPad (no problem with a real computer), a bug that I hope will be fixed in the future. (Update: Vernier is aware of the problem and is working on a fix.)

(Update 21 Sept; it appears that with Apple's update of their operating system iOS7, the bug has been squashed. I am now able to download data using the Safari browser on my iPad and then open that data in the spreadsheet app I have installed. I can now have my guys do some more advanced data analysis that they are unable to do on the LQ2 or on the Graphical Analysis app).


I plan on using this new feature many times in my class room in the future. Thank you Vernier.


You can do the same with the LabQuest2

You can also do the same with the more portable Vernier LabQuest2 DAQ, but it will cost you $350. However, if you are equipping a new lab, I would suggest getting the LabQuest2 instead of the LoggerPro system. Since my students will all have iPads this year, I will be starting to use these.  This year I will use my AP Reading stipend to purchase a handful of them (unfortunately not enough for a full classroom set).


But my school's network is unavailable

Some schools have a very restrictive computer policy. I know of one school system where the computer hard drives are wiped clean every night and the standard applications are re-installed for the next day. Asking for anything special requires a long paper trail and many days. If this sounds anything like your school, create your own wireless network. All you need is a cheap wireless router. Then connect your LB2's and your other devices to that network.

Since your wireless access point doesn't have to be powerful to get to the other side of your classroom and you don't really need encryption, you can use an old or cheap router. Maybe someone at your school who has upgraded has one you can use. Or you can find on sale for $10-$20. It is not that hard to set up your own private wireless network. Just give it a good name. Mine is Charon (one student each year gets the reference).


26 October 2012

A simple demo, a deep result


Sometime Simple is Better

Every physics teacher has a favorite way of demonstrating that a horizontally projected object falls toward the ground at the same rate as a dropping body. Some show a video of shooting a monkey falling from a tree. Some have a device that drops a ball at the same time as it pushes a ball outward.

http://www.chinalabsupplies.com/collision_ball_app/1476.jpg

I used to use such a device to introduce projectile motion.  However, I have recently have started to use instead a simpler way thanks to something I learned from from a meeting of the Western New York Physics Teachers Alliance. Using a popsicle stick and two washers or coins, you can have your students do the same.


Start with what they think will happen 

I like to start with what students "know" will happen. They "know" that an object dropped straight down will hit the floor sooner than an object flicked out horizontally. They also "know" that the faster the flicked object is moving, the longer it takes to hit the ground. I then give each team of two one stick and two washers (you can use pennies or student-supplied quarters). Their task is to figure out how to use this stuff to make one washer fall straight down at the same time as the other washer. I am still trying to figure out how to guide my guys to the proper setup. I give a hint about videos they may have seen about ripping a tablecloth out from under expensive china and fragile glassware. Some take the hint, however, for sake of time, I have to stop the exploration time and lead them to the best setup.

Once we have this setup, I let my guys experiment. It doesn't take long before most teams realize that both washers hit the ground at about the same time. We then get to the basics of projectile motion.

Bring it home

At the end of class, I tell my guys to "confound your parents with this". We figure out that a ruler can be used along with pennies or quarters. I know that most will not do this at home, but a few might. This year, a couple of days later, one guy came up to me after class and said, "I showed my mom this and she didn't believe it so we spent about an hour doing this." One small success.

18 October 2012

Saying goodby to a treasured question

The Lance Armstrong Question

Sometimes, you get a physics question that really works, whether as a in-class group discussion, a homework assignment, or an assessment question. One of mine was the Lance question.


When we cover work and power, I have my guys measure their own power output. While some do this by bench-pressing or squatting weights, and once one guy pushed a car, most do it the simple way by running up a flight of stairs. Most get around 1 hp for for this brief burst (I love the ones who get 12 hp or even 100+ hp. I try to make it a lesson on checking to see if your calculations make physical sense). On the subsequent test, I ask the question:

In the 2001 Tour de France, Lance Armstrong rode up (at a constant speed, equivalent to running up) the mountain L’Alpe Duez (which is 3500 feet high) in 38 minutes.  His weight (with bicycle) is 180 pounds.  What work did he do in lifting himself up L’Alpe Duez?  What was his average power (in horsepower)?  


The answer is around 0.5 hp. I would then during the test review compare his power output to the student's. Most would recognize that their output was for only a few seconds, whereas Lance's was for more than half an hour. I would then tell the class that this was the third climb of the day, the previous two almost as high. Then I would tell them that the climb occurred at end of a 100+ mile race and that it was the 11th day of racing. Some students would be impressed by that athletic feat.

It was a nice way to relate a calculation that we do in class to real-life. However, with recent revelations, I can not with good conscience include this question in future classes. I recognize that performance enhancing drugs will give only about a 10% boost in output for athletes at that level, but most students would not recognize that distinction. I will miss using this classic example.


Post Script

This post has my replacement for the Lance question. 

04 October 2012

Bill Gates, fund this experiment

My guys want to try this experiment, we just need the money.

It is time for the projectile motion labs. While I have the guys in the regular physics class use photogates to determine the speed of a marble at the bottom of a ramp and from there predict how far away the marble will land on the floor, I try to make things a little more challenging for my AP guys. I have them make the prediction based on the vertical drop on the ramp. The day of, we spend the first few minutes making sure everybody has the right equation. This year, after we go to this point


one guy blurted out, "So, gravity doesn't matter!" Another chimed in "We could do this on the Moon." Now we just need to raise the money.

29 September 2012

Puppy Linux saves me

Your computer is going to crash; are you prepared?

I had warnings. I kept getting that my computer was running low on tmp space. I would go and empty that directory, but I would still get that warning, so I should have known that something was amiss. However, I didn't have time to check things out; school was starting soon, so I was preparing for that. And, then it happened. I started the computer one day and I got stopped at the command-line. The computer suggested that I reconfigure Xorg which I did to no avail. Again, no time to dig deeper into the problem and I needed to check email. No problem. I grabbed the USB drive on which I had installed Puppy Linux several months ago, told the computer to boot via USB, and I was up and running and doing what I needed to do. I am writing this using Puppy. When I have time, I will use it to rescue my normal Linux installation.

What is Puppy Linux?

http://korzh.net/wp-content/uploads/2011/02/Puppy_Linux_logo.png

One of the results of the Linux and hacker (in the original sense) community is varieties of Linux called minimal distributions. They are designed to be stripped-down versions that can fit on a portable device and run without being installed on your computer. Some are developed to be rescue tools, but others try to fit as much as possible into a small package. Puppy Linux is an example of the latter. You can run it off a CD or a small USB flash drive. An old 1 gigabyte thumb drive is more than enough. Instructions on how to install are very easy to follow.

What do you get?

At first glance, you might not expect to get much from programs that take up only 100 megabytes of space. But you get a fully functional system. You get a web browser, word processing, picture editing, music playing, and everything you use on an everyday basis. You also get the ability to do file management on the files on your computer's hard drive, even if you can't start up your normal operating system. Afraid you are going to lose those irreplaceable photos from a wonky hard drive? You can copy them to another flash drive or to CD with Puppy. Need to edit a document for school? You can do it with Puppy. Need to replace a corrupted system file that you think is preventing you from booting up normally? Do it with Puppy. If all you do with Puppy is recover from a computer crash, it worth spending a couple of hours downloading and trying it out.

Save old hardware

 Do you have an older laptop or desktop that is running slow and now just sits in the basement. Give it new life with Puppy. Since load itself into your RAM memory, it runs very fast. Do you have an older family member or young student who just needs to do basic document preparation, e-mail, and web browsing? Install Puppy to the hard drive and they are good to go with the added benefit of not having to worry about viruses. Need something special? Check out the different varieties called Puplets made by members of the Puppy community to serve special needs and desires.

Given that more and more of our lives are dependent on computers that fail at inopportune times, you should be prepared. Puppy Linux can be a life-saver.

22 September 2012

What is your local acceleration due to gravity?

How much does gravity suck?


One of the ubiquitous labs in high school physics is a variation on the gravity lab, where students measure the local acceleration due to gravity.  Whether the method is with free-fall, a ramp , or a pendulum, this lab is probably the first time they have measured an important physical constant. I have my classes do the pendulum lab first with manual timing (see note below), and then with electronic timing. As a measure of how good their work has been, their result is compared to the best measure of the local acceleration. There are several on-line sites that will try to calculate an approximation for your location like the one at NGS, but you might live near an actual measurement site.


You can find the results of actual National Geodetic Survey measurements from a nearby station at this site.  My school is about a mile away from this site, so my students can compare their results to actual, professional results made at a site they can visit.

If you do live near such a site, a document like above might make such a measurement more real for your students.

Addendum

I like to do the gravity-pendulum lab twice in my class, once with manual timing, and then with electronic timing. However, the real purpose of these labs is to have the students write formal lab reports.
For the manual timing one, I give no guidelines other than "You learned how to write one in chemistry." and "Have someone else, like your mother or father, read it before you hand it in." I want to see what they consider a good write-up. Of course, most give me a hastily thrown-together hack job, with no evidence of an outside reader. After I grade these, we have a discussion of how to make the writing better. They then have a chance to improve that skill with a redo of the lab, but with electronic timing. I tell them I expect not only much more precise writing, but much more accurate results.

18 September 2012

Using WinPlot (and a hidden feature)

Sometimes, you need to insert a simple graph or blank axes into an assessment.  Some might use the charting features in a spreadsheet such as Gnumeric or Excel, while others may use a graphing app built into their computer's OS.  However, for good customization, you need a plotting program.  I highly recommend the free program WinPlot, by Peanut Software.

WinPlot is a labor of love of Richard Parris at Phillips Exeter Academy.  He updates the program frequently and is very open to suggestions for improvement.  The program is very easy to use, runs without officially installing it onto a computer (you can run it from your own personal directory), and has a lot of useful features. It is my "goto" for inserting graphs and axes into my class documents.  This post will not attempt to be a tutorial on how to use WinPlot; one can be found at the main site.

The one "hidden"feature that got me excited today is a quick way to edit a WinPlot graph already in an editable electronic document.  For years, whenever I wanted to change the labels on a set of axes, I would open up WinPlot and either modify an already saved plot or create a new one with the wanted labels.  Today, I stumbled upon a shortcut.  Below is a graph that I had created in WinPlot, copied there, and then pasted into my word-processing program.

I want to change the label on the vertical axis.  By clicking on the image, I entered the edit mode, as shown by the corner marks.  And, then by clicking on the axis label, the textbox is selected for editing.


I can then change the label to anything I want without having to go back to WinPlot.


A time saver that I will use many times in the future.


Addendum

While I have much praise for WinPlot, my one complaint about is that it is a Windows only program.  Whenever possible, I like to use cross-platform programs.  For publication-ready plots and graphs, I recommend GNUPlot, which is cross-platform.  GNUPlot is by itself a command-line program, but there are many GUI's available that are helpful (the Windows and Mac versions already has the GUI built in).  It is much more powerful program than WinPlot, and so can take some time to learn, but it will produce graphics that can be use in professional publications.  If you are looking for the Ferrari (but still free) of graphing programs, try GNUPlot. However, as powerful as GNUPlot is, it still can't do the above trick that WinPlot can.

31 August 2012

Chemistry and Biology in 3D

View Molecules in 3d

Sometimes, you need a "Wow" factor in class. In chemistry textbooks, pictures of typical molecules, even in colour, can be rather ho-hum. Fortunately, there are many websites where students can view and move around the molecules mentioned in class. However, you can take it up another notch. You can show your class these molecules in 3d.

My favorite molecule viewer is Jmol (which can be found at jmol.sourceforge.net). I won't go through a tutorial on how to use it; I will assume you can get the basics just by playing with it.  I do want to show one feature hidden deep in the options. You can display molecules in 3d

A use for those funny glasses

Of course, to see in 3d, you need those funny, two-colour glasses. If you don't have a set hanging around, a quick internet search will find you some.

Start Jmol and load your favorite molecule like below (bonus points if you can figure out what it is).


With your curser on the molecule (do not use any of the toolbar options), right-click and you will see the options below.


You will need to chose the appropriate options depending on the glasses you use. If you can get a classroom set and have a computer projector in your room, this is a "Wow" factor for your kids.

And also for Biology

You can also use this site to show your students DNA in 3d with the same impact.


You can do the same rotations and zooming that you can do with simple molecules. A neat tool to help students visualize these aspects of chemistry and biology.

The end of summer

The end of summer

For years, my summer Sunday evening routine involved sitting on the front porch, with a book and maybe some wine, watching the neighborhood kids being kids, and listening to the radio.  Until recently, Buffalo was blessed with two NPR stations.  With those stations, I had choices for my listening pleasure.  I could listen to This American Life, Living on Earth, Tech Nation, To the Best of Our Knowledge, and other intelligent programs.  They were a nice way to relax, but also to learn something. The Sunday evening before Labor Day became my "end of summer" ritual. The upcoming Sunday evenings will be spent grading papers, revising lessons, and the other chores of a typical teacher. The radio might be on, but I can't always listen as intently as I can during the summer. So I would experience a mindshift when I turned off the radio that final summer Sunday, when the quickening twilight reminded me that the days are shorter, that the routine of the school year was ahead.  It was an evening that I both dreaded and looked forward to.

This year, things changed. The two stations merged into one, with weekend programming becoming blues music. Those programs I like are no longer available at those times.  And listening to podcasts is not the same. There is a lose of immediacy, the feeling that if I don't listen now, I might miss something good. The current segment playing on the radio might not be too interesting, but the next one might be. For example, looking at the podcasts available for This American Life, I probably would think the episode with this description, "For Father's Day, stories about fathers going out of their way to protect their kids, and kids going out of their way to protect their fathers",would not be of interest to me, and I probably would not download it. However, since I had listened to that show live, I got to hear the tale of a single father trying to save his pre-teen daughter from disappointment. Even though she did not say it, I got the impression the daughter, in between her sighs, really appreciated her father showing how much he cared, a story best told via radio. It was tales like that that made my summer Sunday evenings a delight of discovery.

 So this year, as I sit on the porch, I will be listening not to the radio, but to a podcast, to programs that I have chosen. The shows will be just as enjoyable, but I will miss that feeling of child-like eagerness anticipating something completely unexpected coming from the radio.

29 August 2012

Crayons for Whiteboards

Crayons for High School Kids

Many high school physics teachers use Whiteboarding as a part of teaching.  While the boards last almost forever (try cleaning with foaming bathtub cleaner if they get grungy), the markers don't.  Students go through the traditional wet markers with little thought.  They leave the caps off while discussing; they mash the tips to cottonball consistency. Some teams spend more time trying to find a marker that works than they do in working on the task at hand.

Last year, a teacher at a meeting of the Western New York Physics Teachers Alliance told us about discovering Crayola Crayons for Whiteboards.  I bought a couple of boxes to try them out ($4 for 8 but only 5 colours usable).  Kids loved them, mostly because of the novelty.  But they lasted.  The trouble was that they were hard to find and still a little pricey.

This summer, as I was in a WalMart, I looked in the Back to School section, hoping to find the Crayolas cheaper than they were in Office Depot.  They weren't there but I did spot Cra-Z-Art washable jumbo crayons (16 for around $2, but only about 12 usable colors).  I bought a pack just to try out.  When I got into school, I did try them, and found they work just as well as the Crayolas.  They write well, and erase usually with a dry rag (I use cut-up old towels), but sometimes need a little bit of water or window cleaner to get all the writing off.


If you whiteboard a lot in class and are annoyed by the excessive use of traditional wet markers, WalMart's Cra-Z-Art washable crayons are worth a look. You will want to keep a set of the regular markers. The crayons write with a thin line that is hard to see across the room, so if you are having the students present there board to the entire class, you will want them to write with the wider markers.

09 August 2012

First days homework


Do you know how to measure?


Just checked the school calendar and saw that the first day of classes this year is a Thursday.  Perfect for what I like to do on the first couple of days.


How wide is your bedroom?


After the usual first day stuff (course structure, classroom expectations, etc), I hand out the first assignment.  Part I is to measure the width of a room three times with a one-foot ruler, then three times with a 12-foot (or longer) steel tape.  The next day we discuss how one can measure the same object with different instrument giving different results.  I then put one student's measurements up on the board and ask the question "Which one is the right width of the room?".  Usually most students will say that we don't know (and I try to get them to realize that we will never know the exact width).  Sometimes, someone will blurt out "the average".  Then the discussion leads to the idea that the arithmetic mean is more likely to be closest to the exact value that is any of the individual measurements. It will be the "best guess".

How tall is a car?


Part II of the assignment is to measure the height of a car and to write down how the measurement was done (I give no directions for this part).  The class discussion the next day starts first with me asking what is meant by the "height of a car".  It doesn't take long to draw it on the board.

Ruffling through the homework pile, I usually find one student's write-up which goes something like "I put one end of the tape measure on the ground and then run it up to the top".  I read it aloud and then draw that description on the board, running the marker along the outside of the car on the board
(sometimes getting "That's not what I meant!").  The lesson here is to write clear and precise directions.

I then ask if anyone directly measured that height.  We conclude that no one did because Mom or Dad would get mad if holes were drilled through the roof and the floor.  So everyone did an indirect measurement, a measurement of something that is related to the measurement we want. 

Most everyone did a variation on putting a long board on the top of the car, holding it level to the ground, and measuring the distance between the board and the ground.

All scientists make assumptions; good scientists realize when they do

"So, when you say that the height you actually measured is the same as the height of the car, you are making a basic assumption.  What is that assumption?"  It takes a while, but with leading questions and other hints, most see that the basic assumption is that they are setting up a rectangle. They are also using the property of rectangles that opposite sides have the same length.  At this point I like to remind my students that we are going to be using a lot of the geometry and algebra that they have learned in the math classes they have had already.

Very good scientists ask if the assumptions have validity

"So, convince me that you set up a rectangle."  Again, it takes a little bit to get the class to realize that there needs to be at least 3 right angles.  It then boils down to having level ground and to holding the board parallel to the ground.  All of this is to get students to realize that the act of measuring is more than just reading numbers off a device.

Now, measure the height of a tree
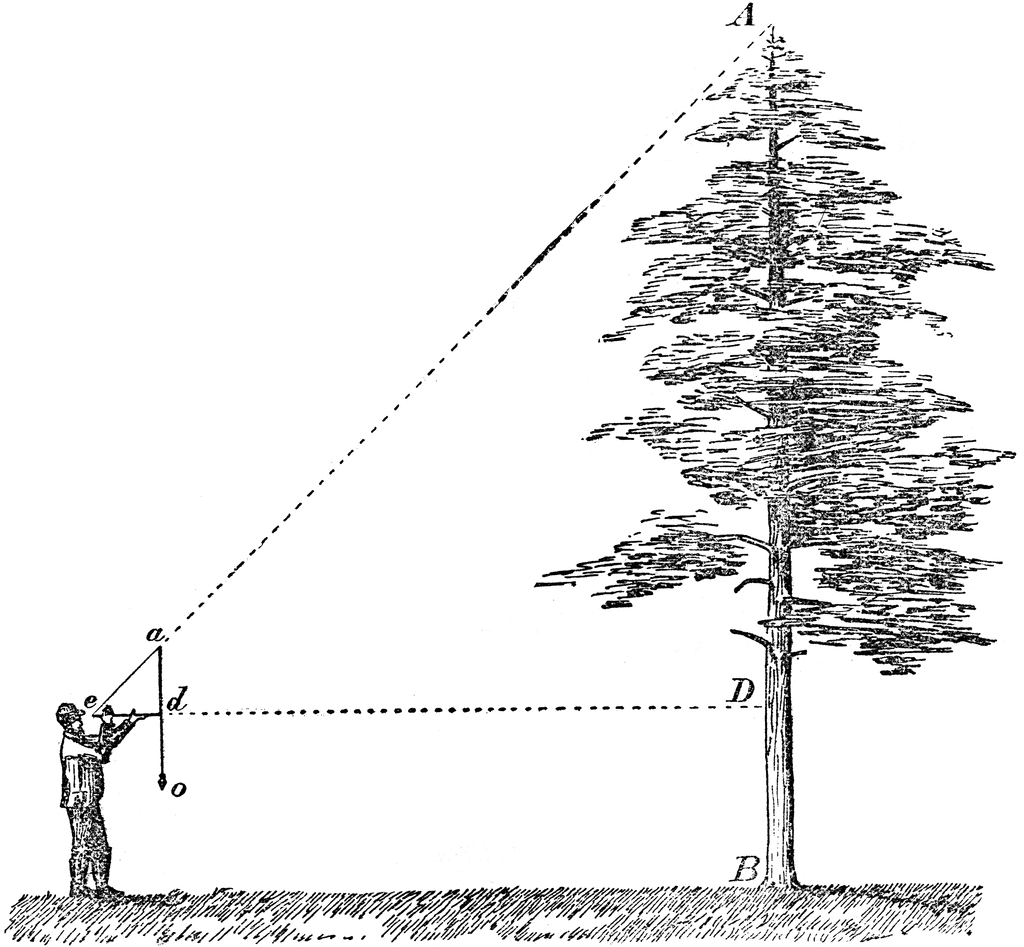
The class wraps up with setting up the next homework assignment which I time for a weekend.  I demonstrate in front of the class (at least twice) the forester's technique to measure the height of a tree. You can see this technique here (the first shown).  Whether students measure the height of a tree, a church steeple, a house, or other tall object is immaterial.  What is important is an explanation of why the technique works and what assumptions are made.  I emphasize that they already know why it works, they just need to think about it. The grading of that assignment is based on a complete and logical explanation.

Most students will realize that it relies on making an isosceles right triangle, but few will see that it really uses two geometrically similar isosceles triangles. I usually have to ask some leading questions in class, my favorite is "Is this enough to show the tree height?". During our in-class discussion, I ask if we have used any new mathematics that they have never seen before. Of course, the answer is "no". I then tell the class (for probably the third time) that they already know the math they need for this class; they just have to think about when they need to use it. This sets one of my expectations for this course; I expect you to remember the important math you have learned in other classes. It will be expected in college.

Just thought of this modification for my AP class.
For my AP students, I have them measure the distance from the starting point to the tree base by pacing (I have my regular physics class measure that distance using a long steel or cloth measuring tape).  So we spend time in class getting a personal pace calibration curve.  In other words, they make a plot of distance paced vs. number of steps using the practice football field right outside our building.  One reason I like to use the marked field is that the hash marks are 5 yards apart so my students have to make some estimations about where their foot is. They get a calibration equation from the best-fit line which is used to get the actual distance paced in feet or meters. Since graphing data and getting a best-fit line is often asked on the AP Exam, this practice starts them with something which already be linear.  


These two assignments try to get students to realize that the act of measuring is not a simple one.  Much thought should go into all aspects of the procedure and that many times subtle assumptions are made, the validity of which needs be examined.  And as with any important lesson, it will have to be repeated many times over the school year.

If I have time at the end of the year, I like to revisit this lab by measuring the height of a "mountain".


28 July 2012

Another way of looking at the odds of winning the MegaMillions or Powerball jackpots


Are you trying to get hit by lightning?

Since the Powerball  and MegaMillions jackpots are getting into "quit your life" territory again ($977 million for MegaMillions and $750 million for Powerball), you might hear a story about it on your local news.  Some try to give meaning to the odds of winning (around 1 in 300 million for each) by saying like "You have a better chance of getting hit by lightning, twice.".  I never liked that analogy because most people try not to get hit by lightning.  I like better the equivalent of blindly hitting the one marked cup out of 302 million.


Will a football field hold 302 million cups?

Well, if they are small enough, about one-eight-inch across. So, let's use those typical small plastic cups which are about 2 inches in diameter.  How many fit into one square foot?  (I find many students answer 6, not the correct 36.  We then discuss the difference between linear measurements and area ones.  To test that concept, I then ask how many square feet in one square yard.)  A high school football field is 120 yards by 53.3 yards.  Putting it all together, we get that the field will hold 2,073,600 such cups.  Which means you need about 146 fields to hold the 302 million MegaMillions cups or about 8.4 million square feet.

Where can I fit 146 football fields?

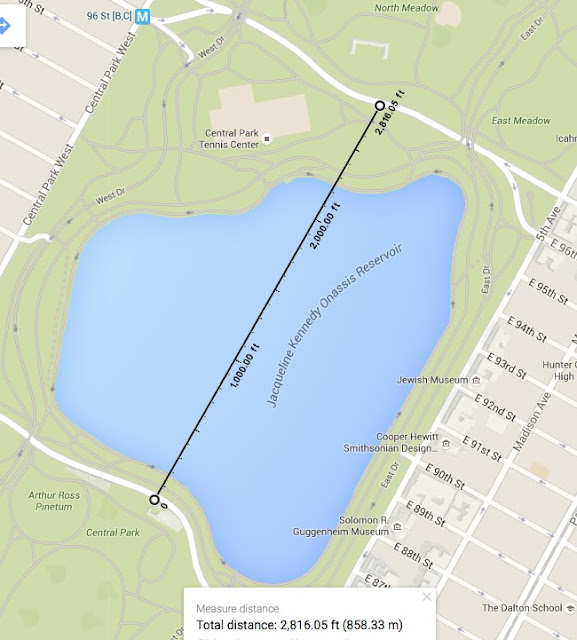
With available online conversion sites such as Google or onlineconversion.com, you could figure out how many acres (193) or square miles (0.30) would be needed, but those would be meaningless numbers.  What about a visual representation?  Would a nearby large park be big enough? How can you figure out if it has at least 8 million square feet?  Let's use Google Maps and the most famous park in the US, Central Park in NYC, in particular the area around the reservoir.

One nice feature that you might not know about Google Maps is that is has a ruler tool.  In the map below, notice the small ruler icon just to the left of the scale legend in the lower left corner.  By clicking on that, you can get the distance between any two points.


So we see that that area of Central Park in NYC bounded by the roads around the iconic reservoir is about 8 million square feet (2800 ft by 2800 ft).  You can do the same with any park that your students may be familiar with.  Now imagine that area covered with cups and you are blindfolded and hovering overhead in a helicopter.  You drop a pebble.  Your odds of winning the MegaMillions lottery with one ticket is the same as the odds of you hitting the one marked cup in this area of Central Park.

For people in Buffalo, NY, we can do the same for its famous park, Delaware Park.


You can see that you would have to fill in the entirety of the Park north of the 198 (including the Zoo) with these cups. So imagine standing by the Statue of David at the top of the hill and trying to hit the one marked cup without knowing where it is. Your odds of hitting the MegaMillions with one ticket is the same.

Using the approximations that a football field holds about 2 million 2 inch diameter cups, you can do the same for any other lottery game with a little arithmetic. For example, the regular NY Lotto would need 11 football fields or 626 thousand square feet.

For friends and family in my hometown of Claremont, NH, here is a map for you.  Fill not only all of Monadnock Park, and the field adjacent to the park and bounded by the Sugar River, but also the residential part between the park and Pleasant St. to fit the 304 million cups for the MegaMillions lottery.


For family members on the Sandy Island Family Camp during the summer, you would need to cover the entire island thrice to get the right number of cups.


Another aspect of these lotteries can be seen at another blog post of mine.

30 June 2012

The Shortest Day of the Year

30 Jun is the longest day of the year and 5 Jul is the shortest.

Because of the leap second at the end of 30 June, it can be considered the longest day of the year (by one second).  But did you know that 5 July can be considered the shortest day of the year?

How long is a day?

Ask someone how long a day is and you will probably get the answer, "24 hours". However, ask someone at the US Naval Observatory and you will get "1420x106x60x60x24 vibrations of a hydrogen maser". Ask a farmer and you will get "From sunup to sunset". We have any different definitions. For this post, I am going to use the synodic definition, the time it takes the Sun to go from due south (local solar noon) to the next time it is due south. 

It starts with Kepler.

 Thanks to Johannes Kepler, we know that the Earth orbits the Sun in an eliptical orbit, and that the Earth is moving fastest when it is closest to the Sun (perihelion) and slowest when it when it is farthest (aphelion). 

This year, aphelion occurs on 5 Jul, which will be the shortest day of the year. 

Let's figure it out.

Since on the above diagram, the Earth is also spinning counter-clockwise, the diagram below shows (with the added lines) one complete rotation of the Earth for both the day of aphelion (3-4) and the day of perihelion (1-2).


Notice that it takes a little more than one rotation of the Earth to have the Sun directly due south again. Also notice that the Earth has to rotate a little more at perihelion than at aphelion to be facing the Sun 1 synodic day later.  So a synodic day is shortest at aphelion.

But how much shorter is it?
  
While the above argument is enough to show that 5 Jul 2012 is the shortest (synodic) day of the year, it does not say by how much.  Is it minutes or milliseconds? To answer this, we will need some numbers and the more precise form of Kepler's Law used above.  Kepler figured out that orbiting bodies sweep out equal areas in equal time. And by looking at the diagram above, you can see that the angle swept out by the Earth in one sidereal day is equal to the extra angle the Earth has to rotate to get the Sun due south.

Since the area of a circular sector is
this gives the relationship between for angles swept in equal time.

The Earth-Sun distance is 152,098,232 kilometres (or 1.01671388 AU) at aphelion and is 147,098,290 kilometres (or 0.98329134 AU).  This gives

(the rest of the analysis will be finished later.  Come back later if you are interested in the numbers)


Classroom use.

Unless you are teaching summer school, this is not much use in the classroom.  However, if you flip the seasons, you can show that the day of perihelion is the longest day of the year (and it is close the the "shortest" day of the year, 22 Dec). Since the first day back from the Christmas break is close to 4-5 Jan, I use this for a gradual welcome-back class.  In a regular physics class, we just do the qualitative approach with students playing the parts of the Sun and the Earth.

The discussion starts with what causes the seasons.  It helps to have a globe handy at this point. We then discuss Kepler's laws. I get one student to play the part of the Sun and one the Earth.  Depending on time, I might have the class discuss how the Earth should rotate (the Sun rises in the east). If not, I will just get the Earth rotating in the correct way.  The class decides when the Earth has