
Linearization and the Pendulum
The technique of linearization of data is a standard tool for data analysis in science. Usually, I get this question from a student. "Why don't we just use the formula to calculate the values from each data point and then take the average?" My reply, "Because linear regression analysis better takes into account the presumed Gaussian distribution of the random and systematic errors in the measurement processes" usually get a blank stare.
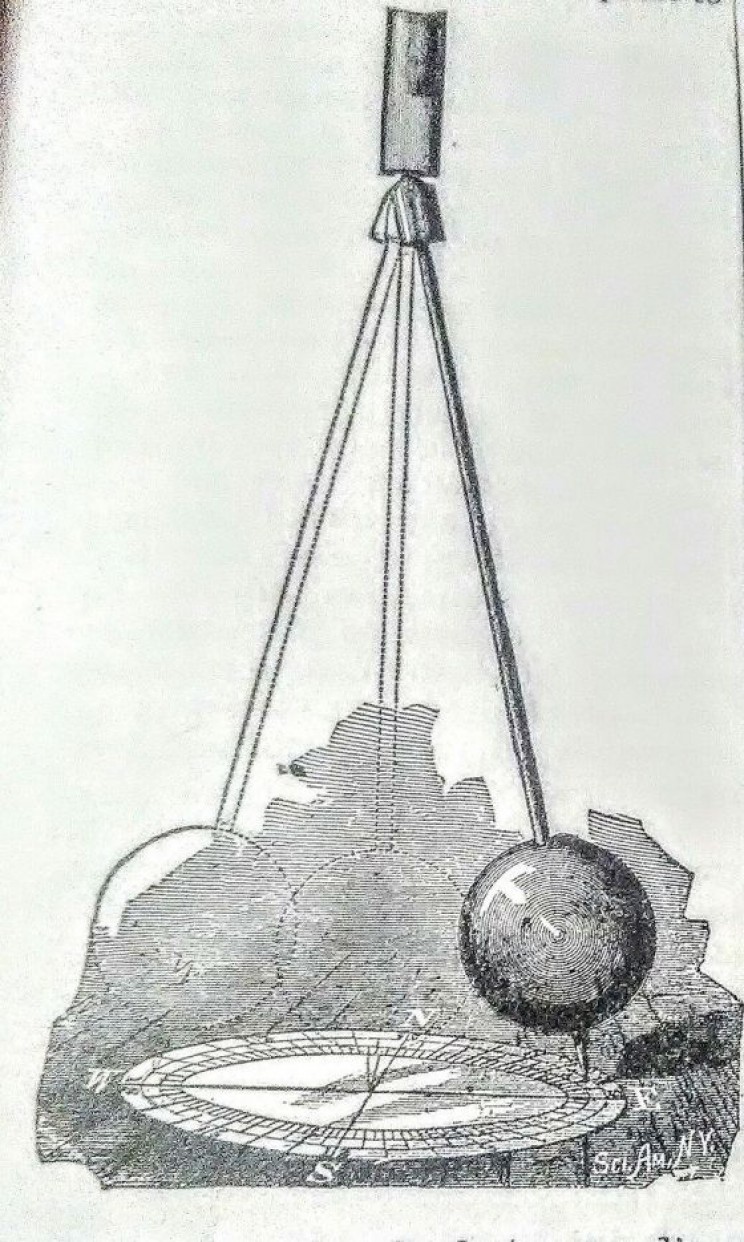
Using a pendulum to get a measurement of the local gravitational field strength is a standard lab activity in high school physics. The standard pendulum equation gives a simple way to relate the length and period of a pendulum to the local gravitational field strength ("g"). However, measuring the length of the pendulum from the pivot point to the center of mass leads to inaccuracies. Unless a highly symmetric mass is used, the center is hard to determine. But using linearization gives a way around that imprecision.
The graph below shows idealized data for a pendulum (solid dots) and data where the measured length is from the pivot to the bottom of the mass(hollow dots). Note that both graphs have the same slope. One can then calculate the value of g using the slope of either sets of data. Since measuring length to the bottom of the mass gives a more precise value, the calculated value of g has more precision. This precision could be had by "just using the formula and taking the average".

Here is a link to a sample lab write-up that you as a teacher can modify for your class.
The above was motivated by an article in The Physics Teacher which I will link to when I refind it.
No comments:
Post a Comment